
Fall officially started last week. I’ve always really liked Fall for the cooler temperatures and changing colors in the surrounding landscapes. As a child, I always looked forward to school starting, meeting new teachers, becoming reacquainted with friends, and Fall sports.
I wish I could say investors looked forward to the Fall, but September has historically been the worst month in the calendar year for stock returns. Stocks are off over 6% so far but the one saving grace is the month-to-date return is still shy of June’s nearly 8% decline. However, we still have two days left.
Asset prices face no shortage of challenges right now from rising rates to quantitative tightening to a softening global economic environment. The good news is we know all this is happening and stock prices reflect these challenges, at least partially. We don’t know how severe some of these challenges could eventually become, which along with future unanticipated surprises are some of the more prevalent risks asset prices face in coming years.
Trends ebb and flow over time. The conditions we experienced over the past few decades appear to be at least partially reversing. How deep and lasting any reversal is as well as the impact on asset prices remains to be seen. There are plenty of doom and gloom forecasts out there predicting dramatic declines and changes. While anything is possible, my experience has been the dourest of expectations tend not to come to pass. Similarly, the most optimistic outlooks rarely occur.
I think we all need a little more perspective and a little less doom and gloom. The daily, weekly, monthly, and even yearly moves in asset prices can be extreme in either direction, causing a lot of heartburn. We’re long-term investors and have a plan that has held up well over time in various types of market environments. I believe looking at decades provides a more useful perspective than looking at individual years.
We’re going to look at stock market returns over the past five decades together with the Shiller CAPE ratio. For those that don’t know, Yale professor Robert Shiller developed a valuation metric that looks at valuations over longer periods of time to help smooth out the ups and downs of the business and interest rate cycles and to account for inflation. A valuation metric provides us with a useful way of comparing how expensive or cheap the stock market is at one point in time versus another. Importantly, valuation metrics, including the Shiller CAPE, are not crystal balls or market timing tools. These metrics provide us perspective and context, which is what we’re looking for right now.
The 1970s
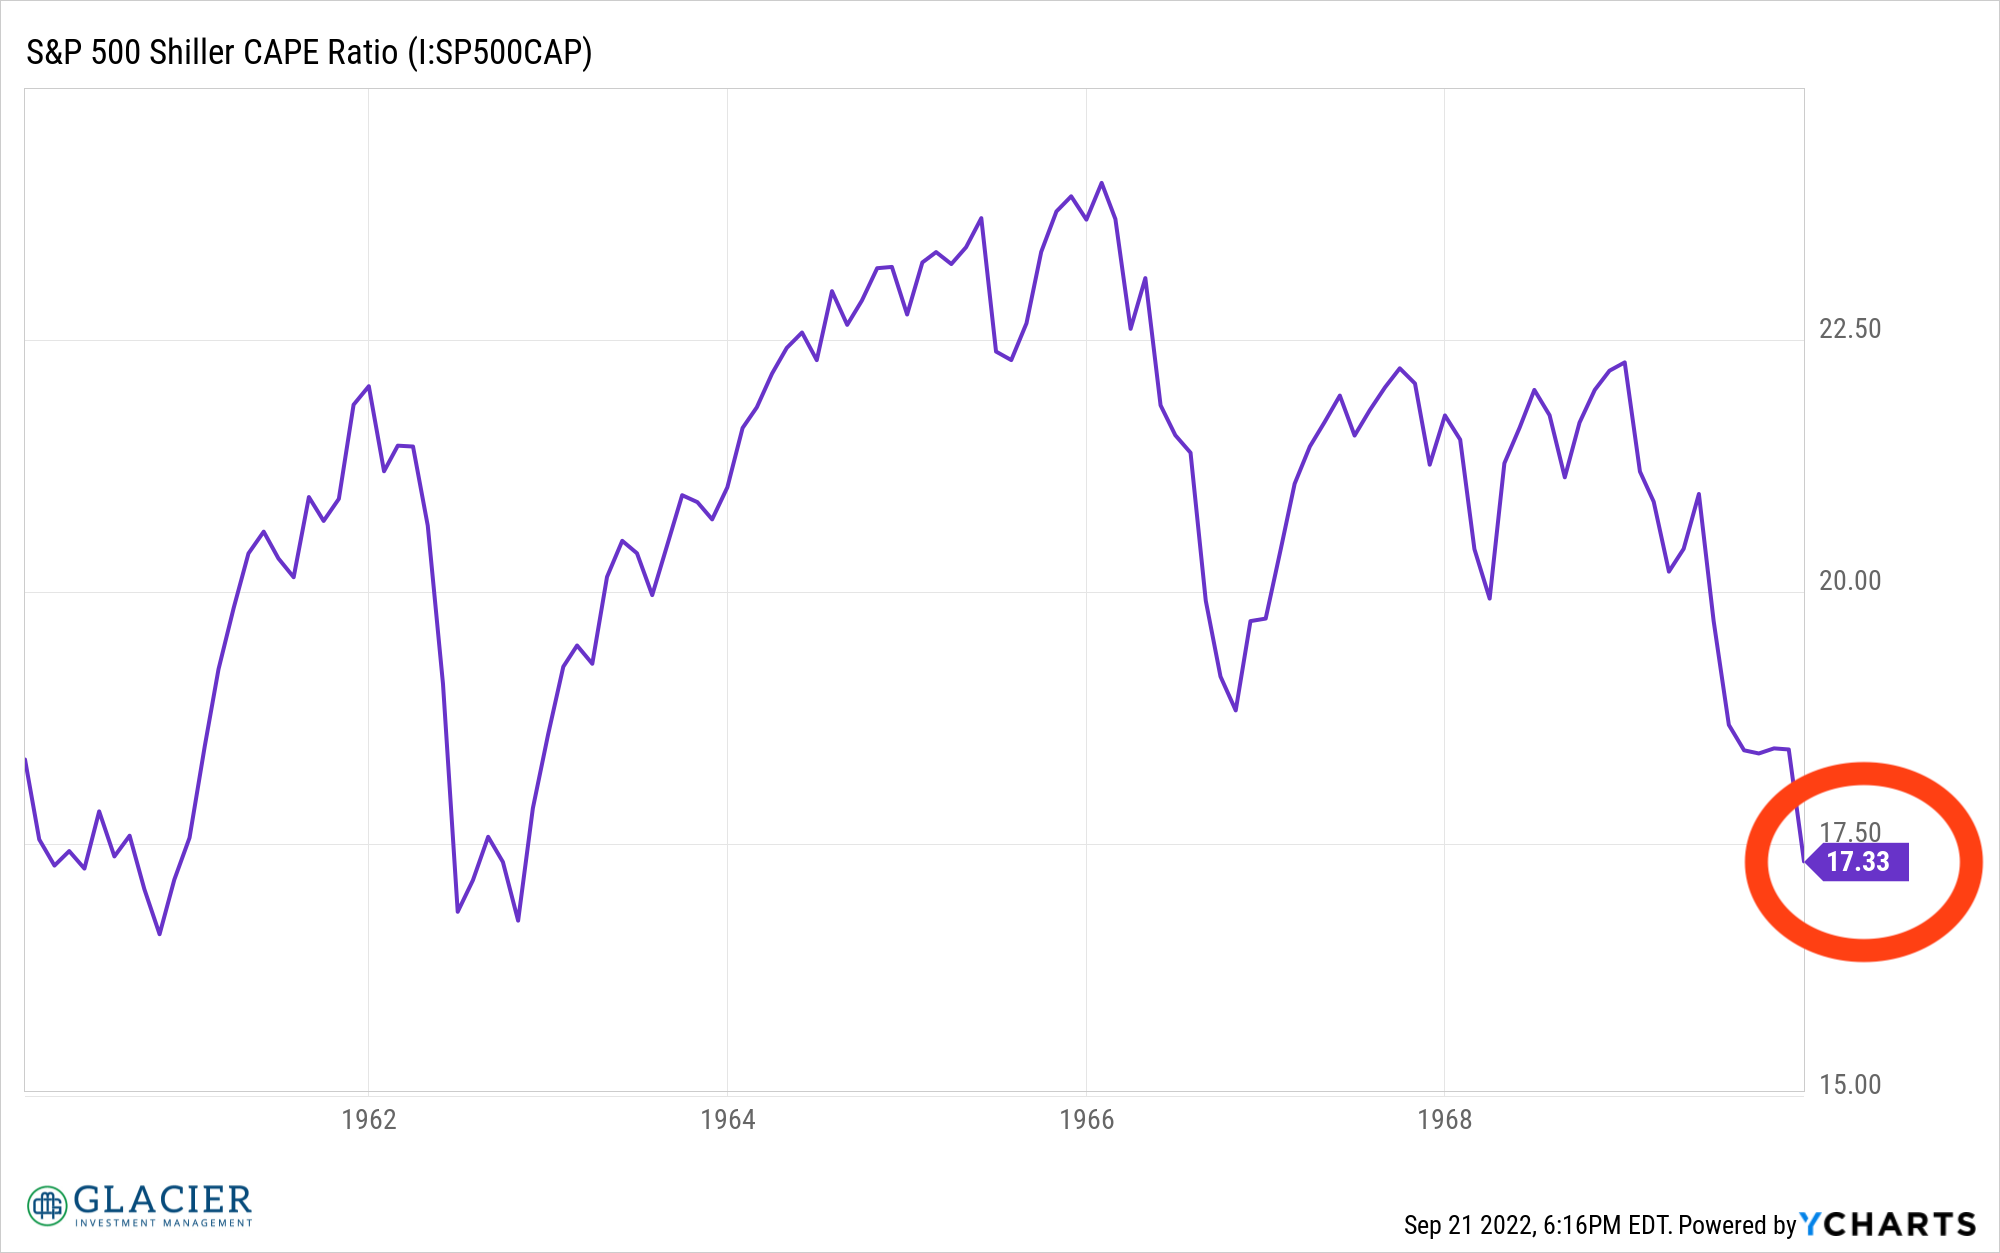
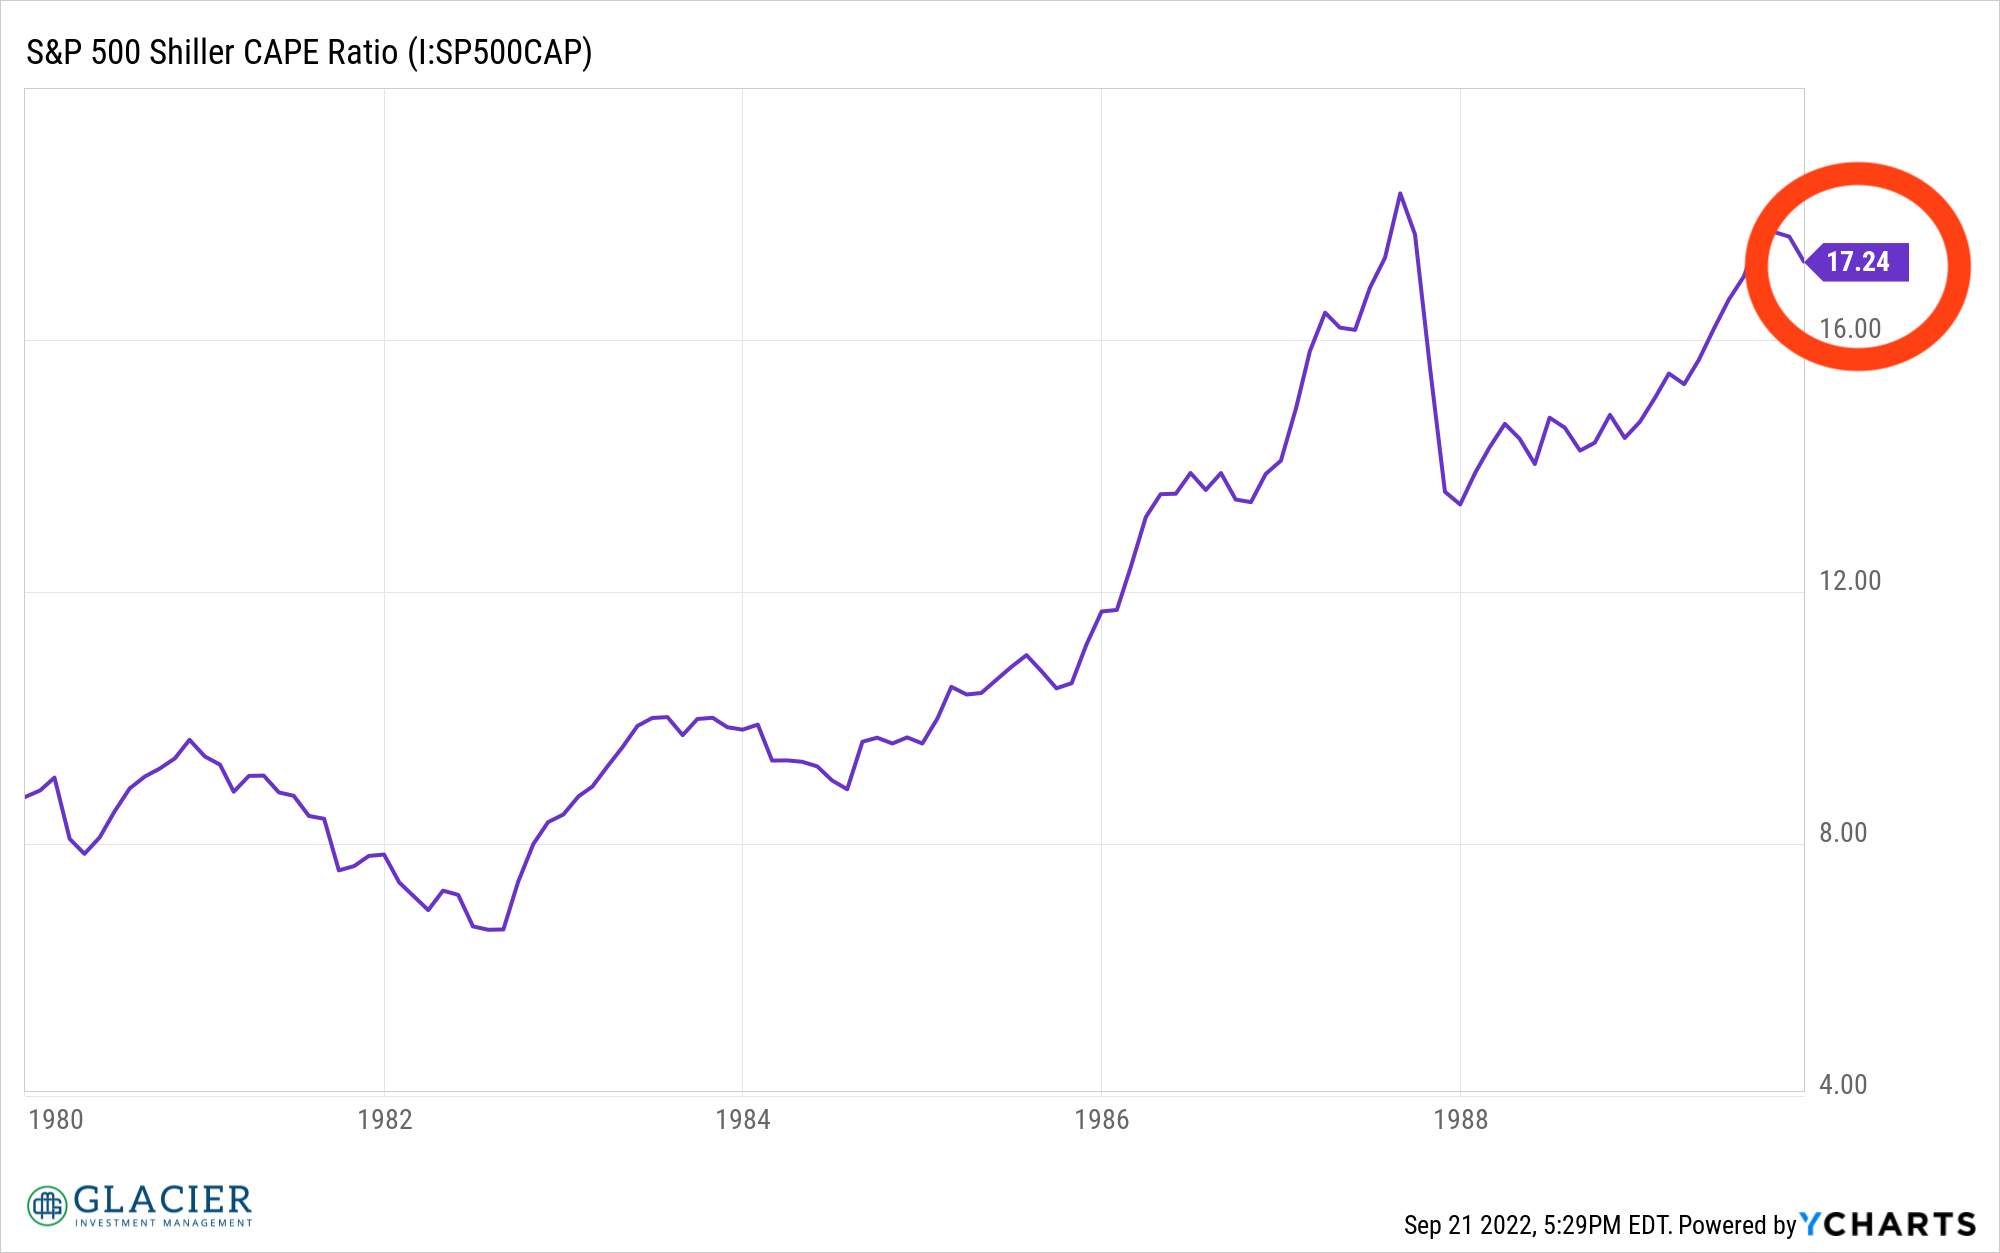
At the beginning of the 1970s, valuations as measured by the Shiller CAPE were at a reasonable by today’s standards, 17.3x. In other words, the S&P 500 index level (think price) was 17.3x the blended earnings for all the index’s constituents at the time. For most of the 1960s, the Shiller CAPE was higher than the ratio during the 1940s and 1950s so it could be argued it was elevated at the beginning of the 1970s. It’s hard to say, even in hindsight.
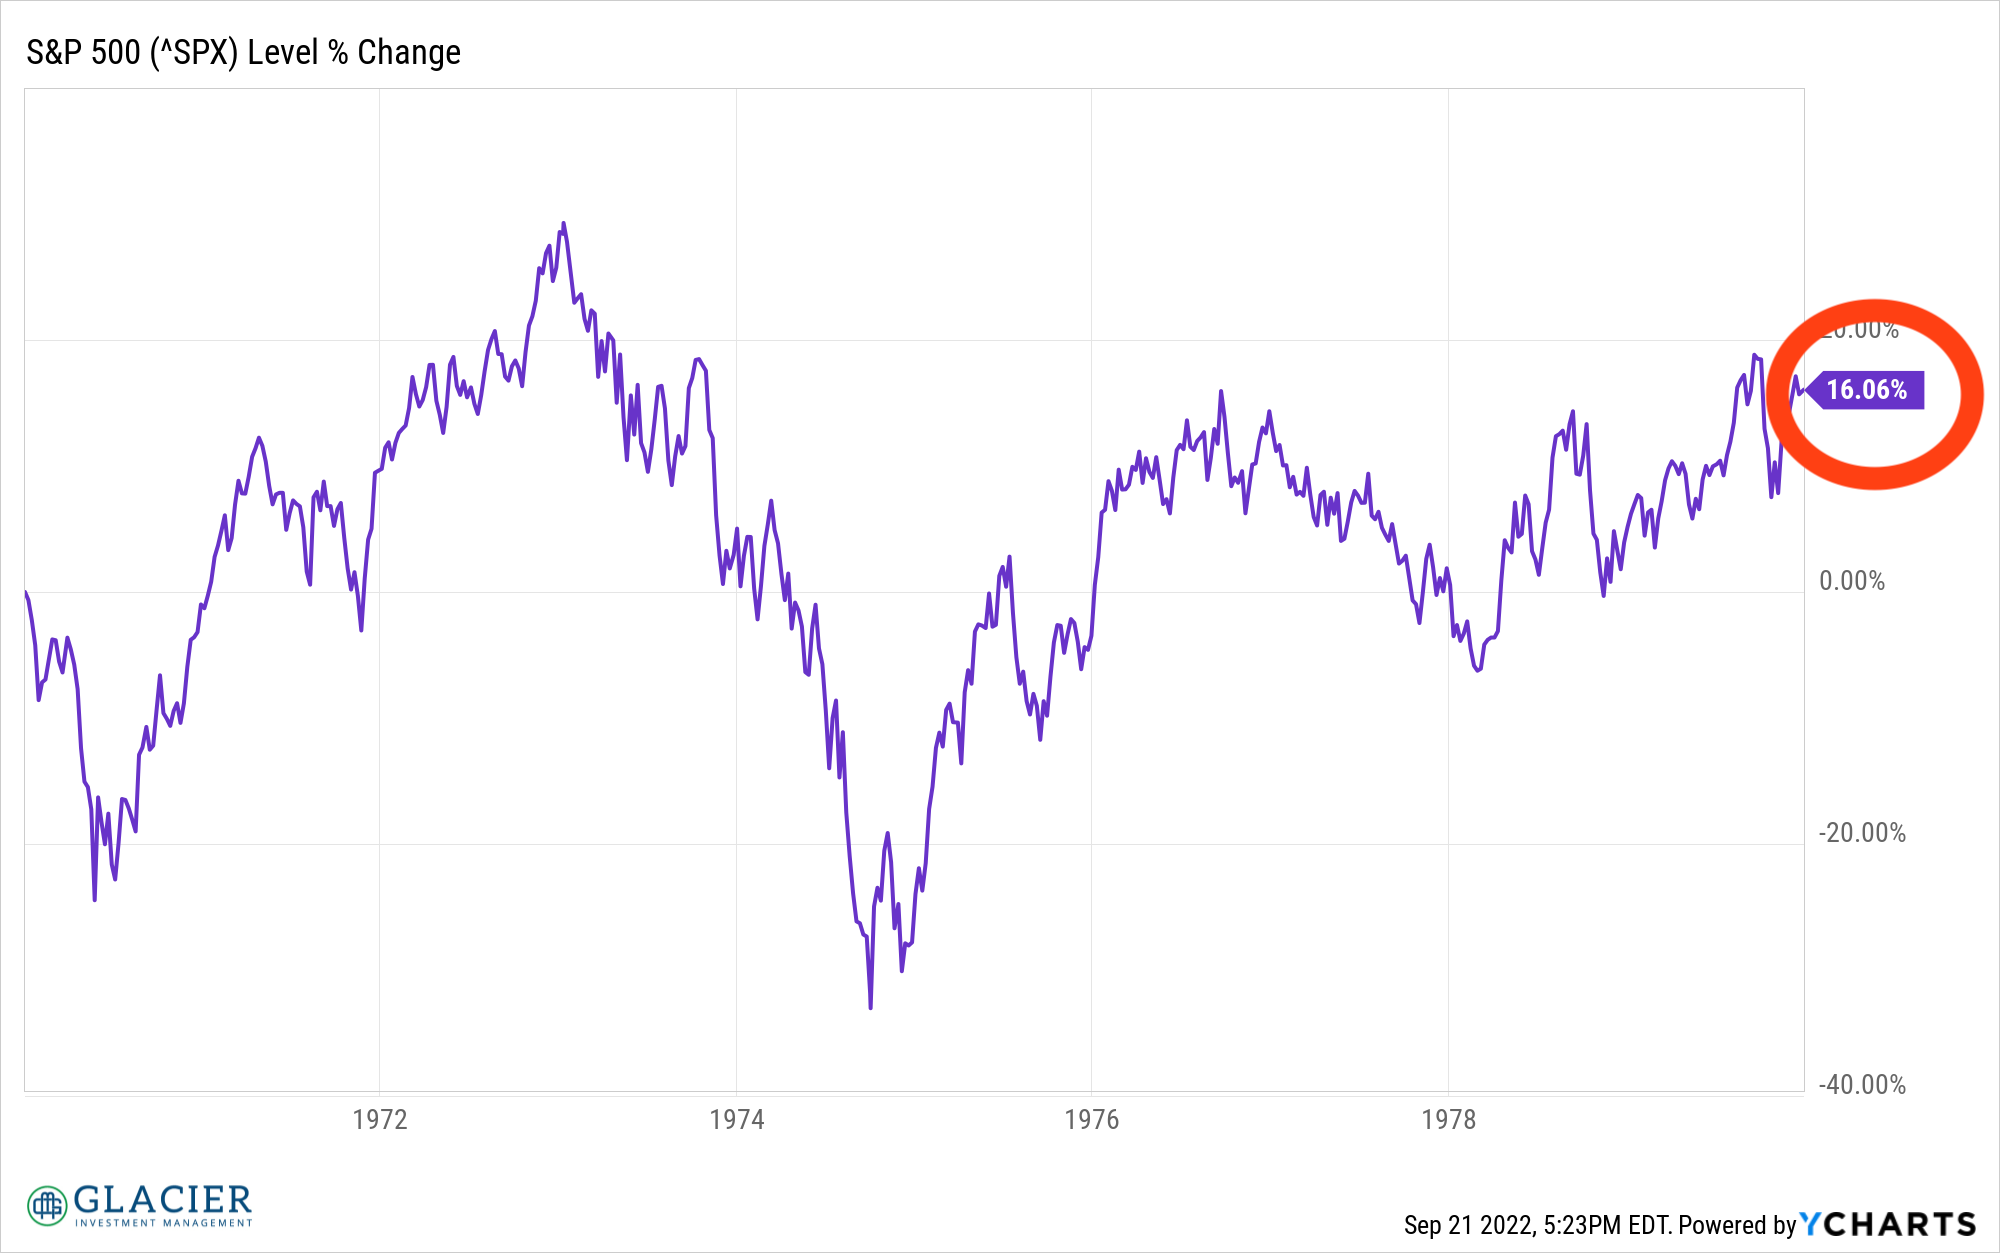
The 1970s were considered a lost decade for stocks, meaning stocks didn’t really go anywhere from a price appreciation perspective. Over the 10-year period, the S&P 500 increased by 16%, or about 1.6% per year. For those old enough to remember, the 1970s were a period of high inflation, rising interest rates, shortages, and geopolitical turmoil. If that sounds familiar, it is in many ways like today. However, there are also several differences that are outside the scope of this post.
The 1980s
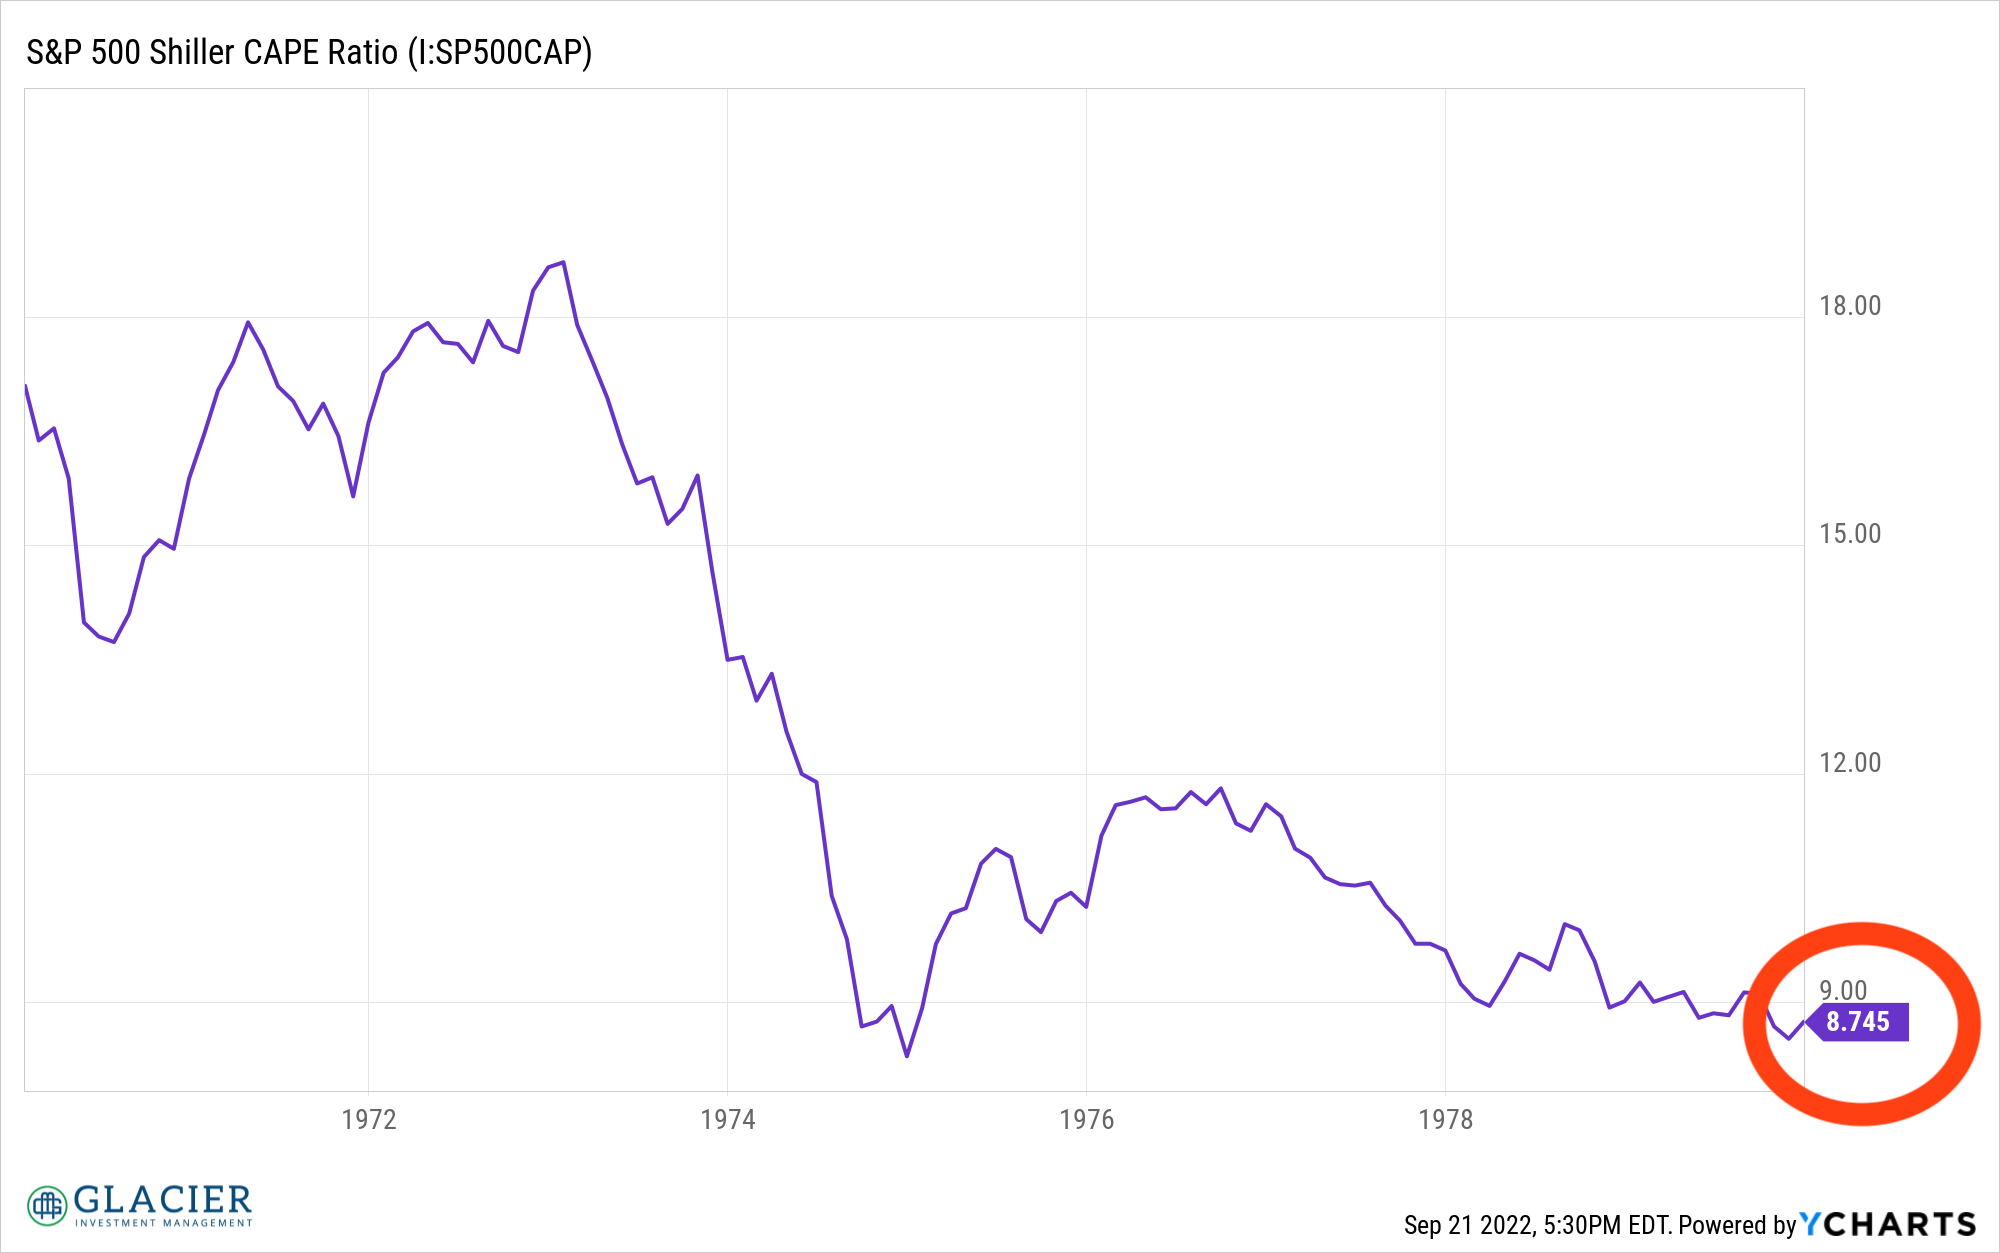
After the lost decade of the 1970s, stocks were very cheap. The now infamous Business Week cover stating stocks were dead in the early 1980s was the bottom, or near the bottom, of stocks for that cycle. The S&P 500 was a paltry 8.7x earnings, as measured by the Shiller CAPE, at the beginning of the decade, half its level at the beginning of the 1970s. For those that aren’t familiar with valuation ratios, what this means is investors could buy the S&P 500 at a level 8.7 times greater than earnings in 1980 versus buying the S&P 500 at level 17.3 times earnings in 1970. Clearly, 8.7x is cheaper than 17.3x, all else equal.
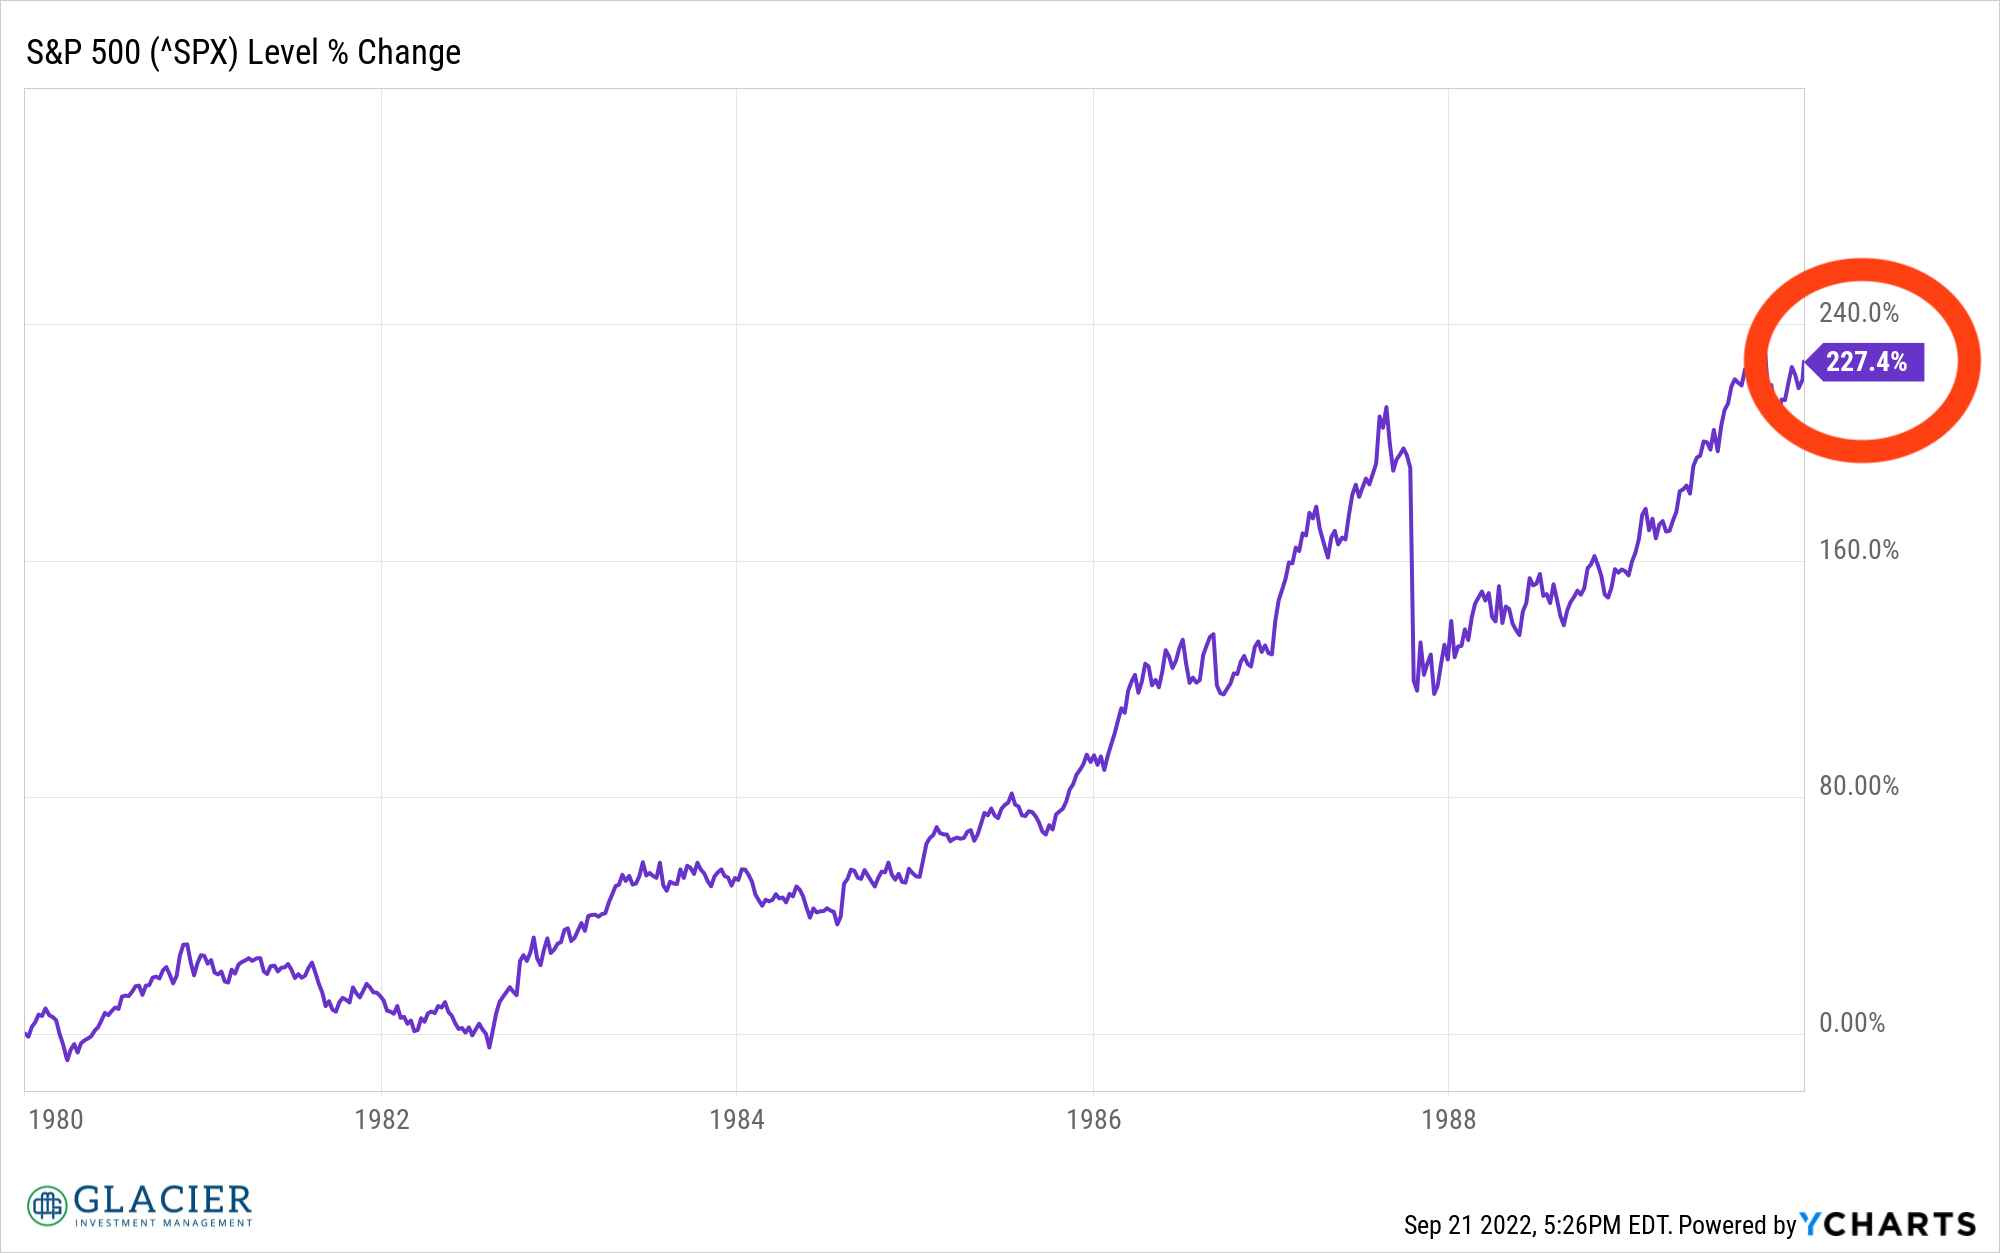
Not surprisingly, stocks had a great decade during the 1980s. While low starting valuations were not the only factor that served as a tailwind for stock prices then, they certainly didn’t hinder stocks’ climb higher. When all was said and done at the end of 1989, the S&P 500 had climbed over 227% from its starting point in January 1980.
The 1990s
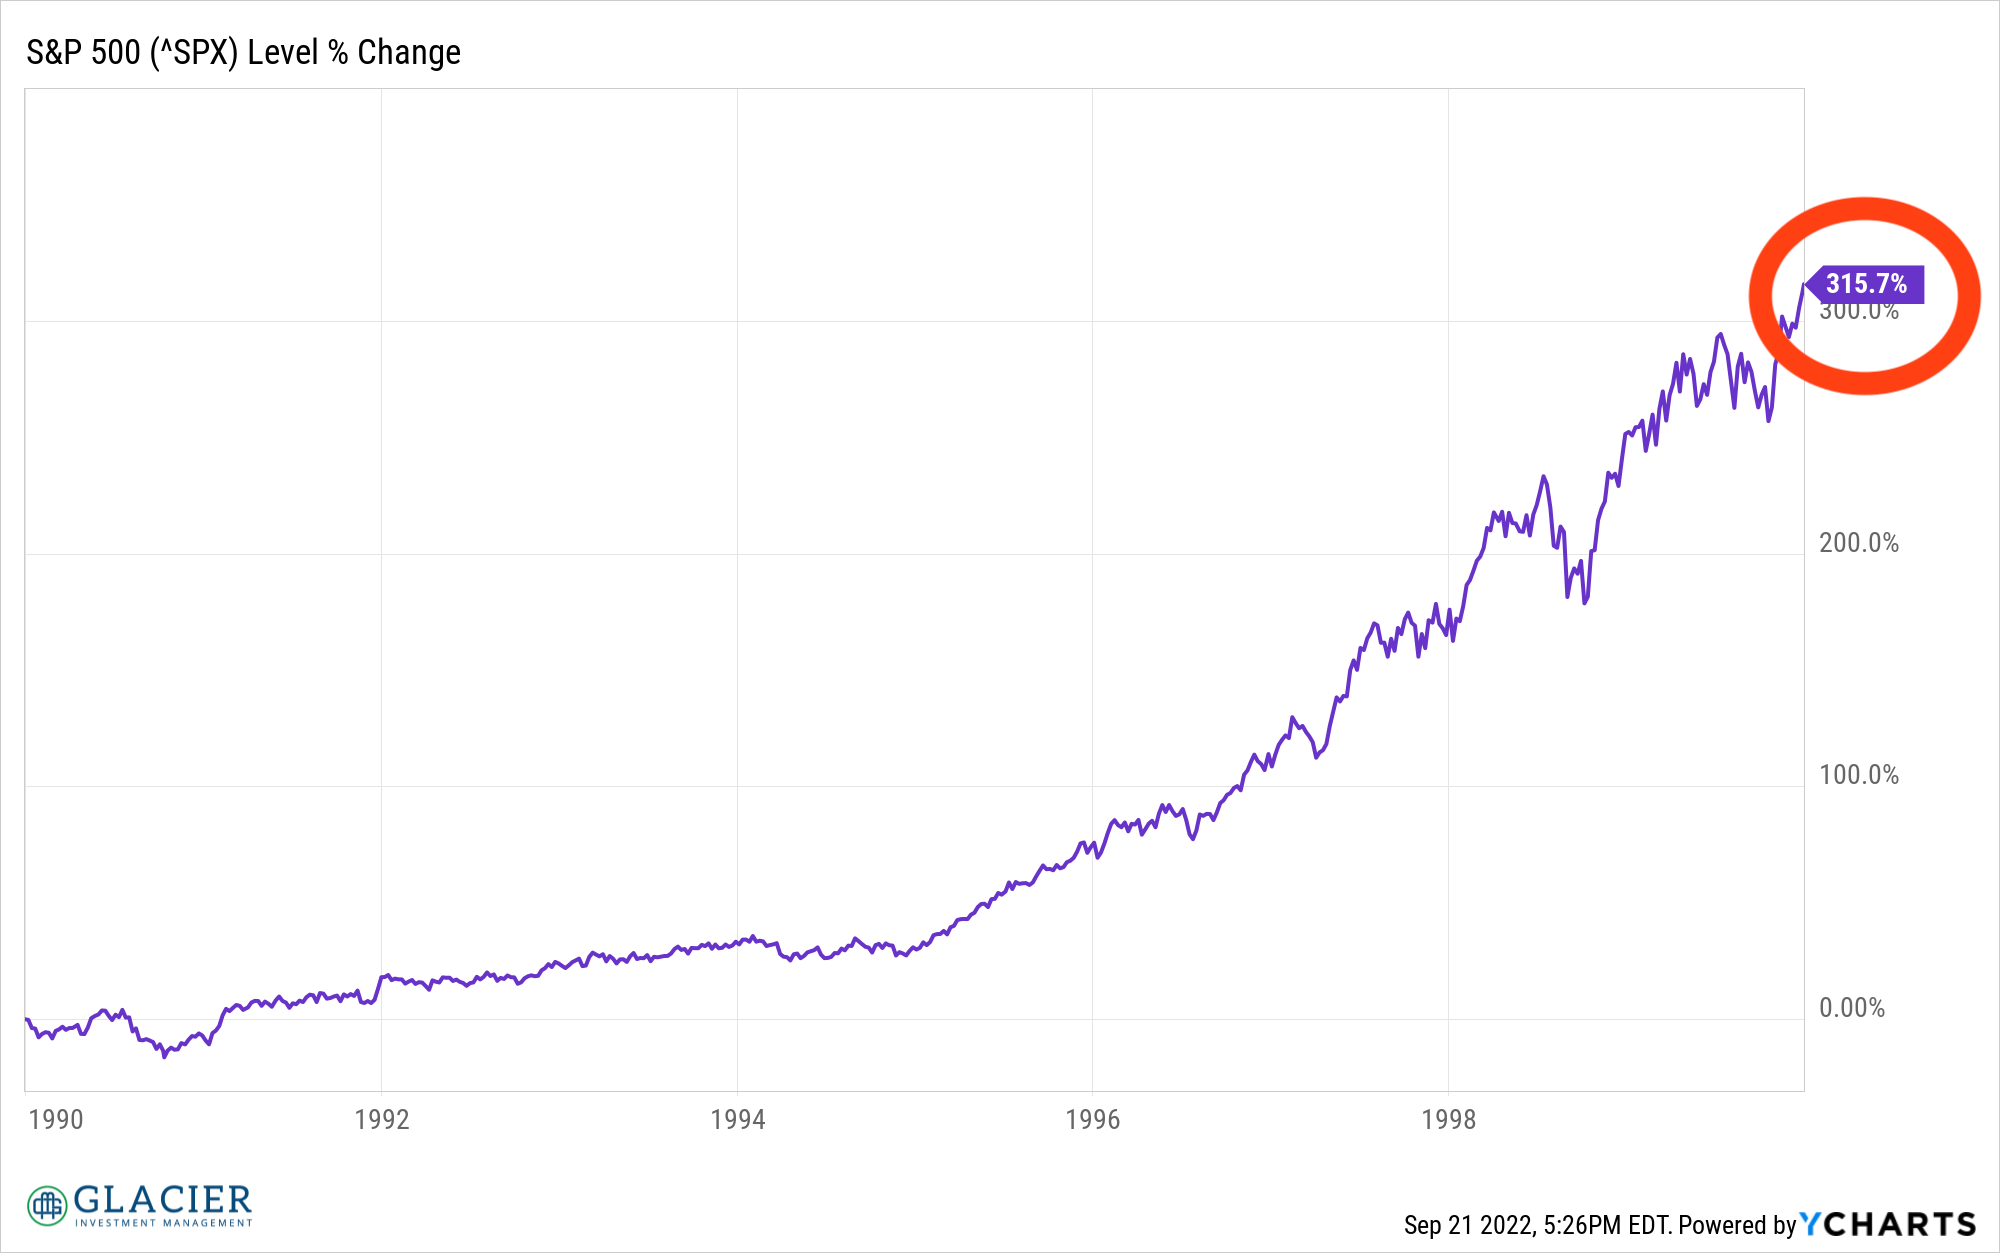
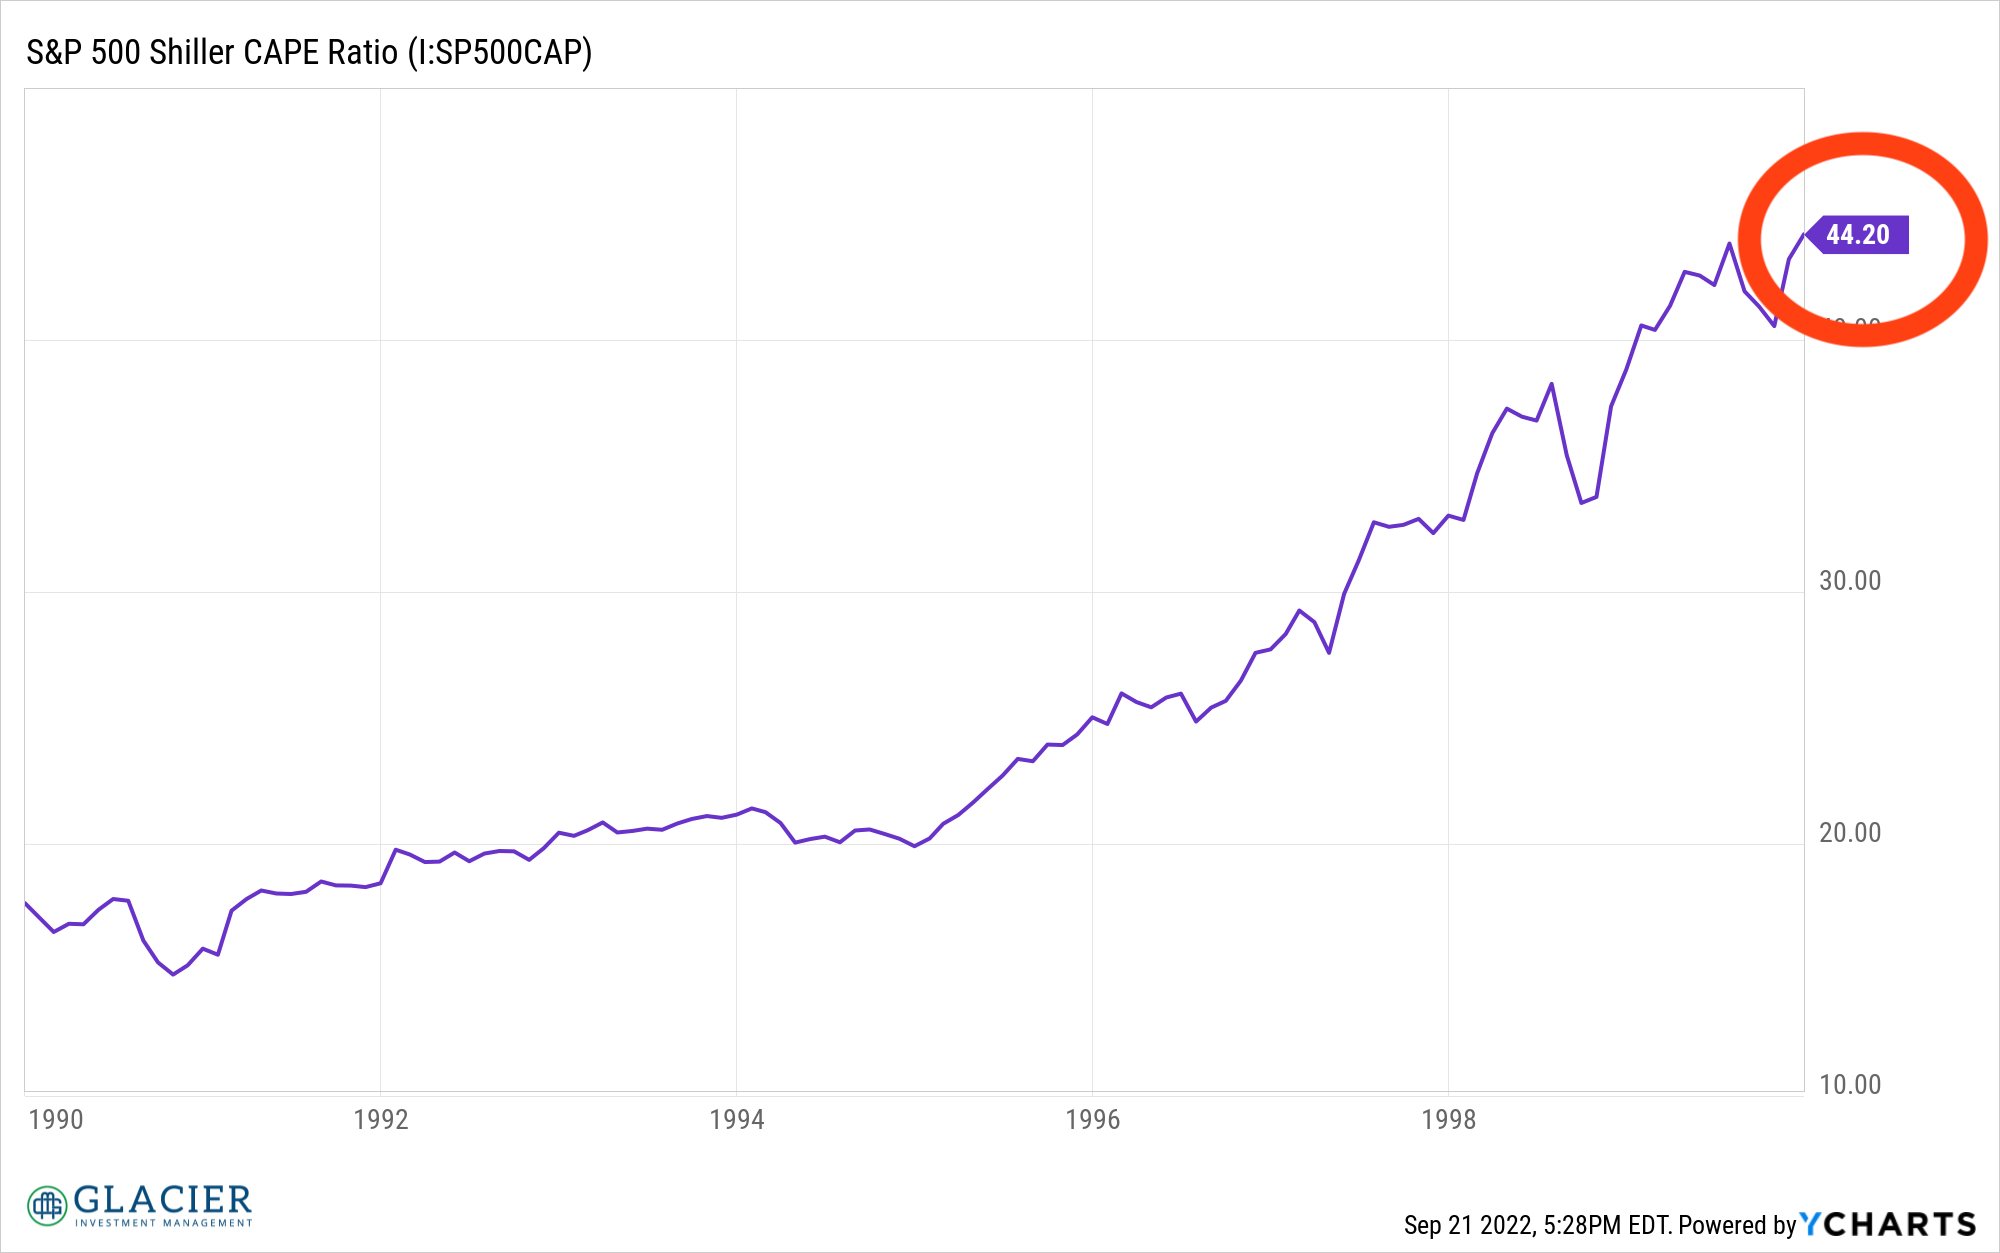
At the close of 1989, stock valuations, as measured by the Shiller CAPE, were back at the same levels as 20 years earlier. Not necessarily elevated but double what they were 10 years earlier. However, other tailwinds were firmly in place including lower interest rates, productivity gains, and the rise of computers and eventually the internet. All these variables and more would lead to a robust decade of stock returns in the 1990s. At the close of the century, the S&P 500 had generated a 315% return over the previous decade. In hindsight, we know this was excessive and ended up being a price bubble.
The 2000s
At the conclusion of 1999, the Shiller CAPE was at its highest level ever, reflecting the rapid climb in stock prices relative to their earnings that occurred 1998-1999. In hindsight, either earnings needed to markedly increase, or growth expectations needed to continue to climb to sustain stock prices at late 1999 levels. Neither occurred and stocks proceeded to have a true lost decade of negative returns. The S&P 500 returned -8.27% from the beginning of 2000 to the end of 2009.
Valuation starting points do matter. It’s nigh impossible to time the market. As I mentioned earlier, valuation metrics are not market timing tools. They do provide important perspective. While we can look at 1999 with the wisdom of hindsight, as a general rule of thumb it doesn’t pay to be aggressively long stocks when valuations are at, or even near, an all-time high.
The 2010s
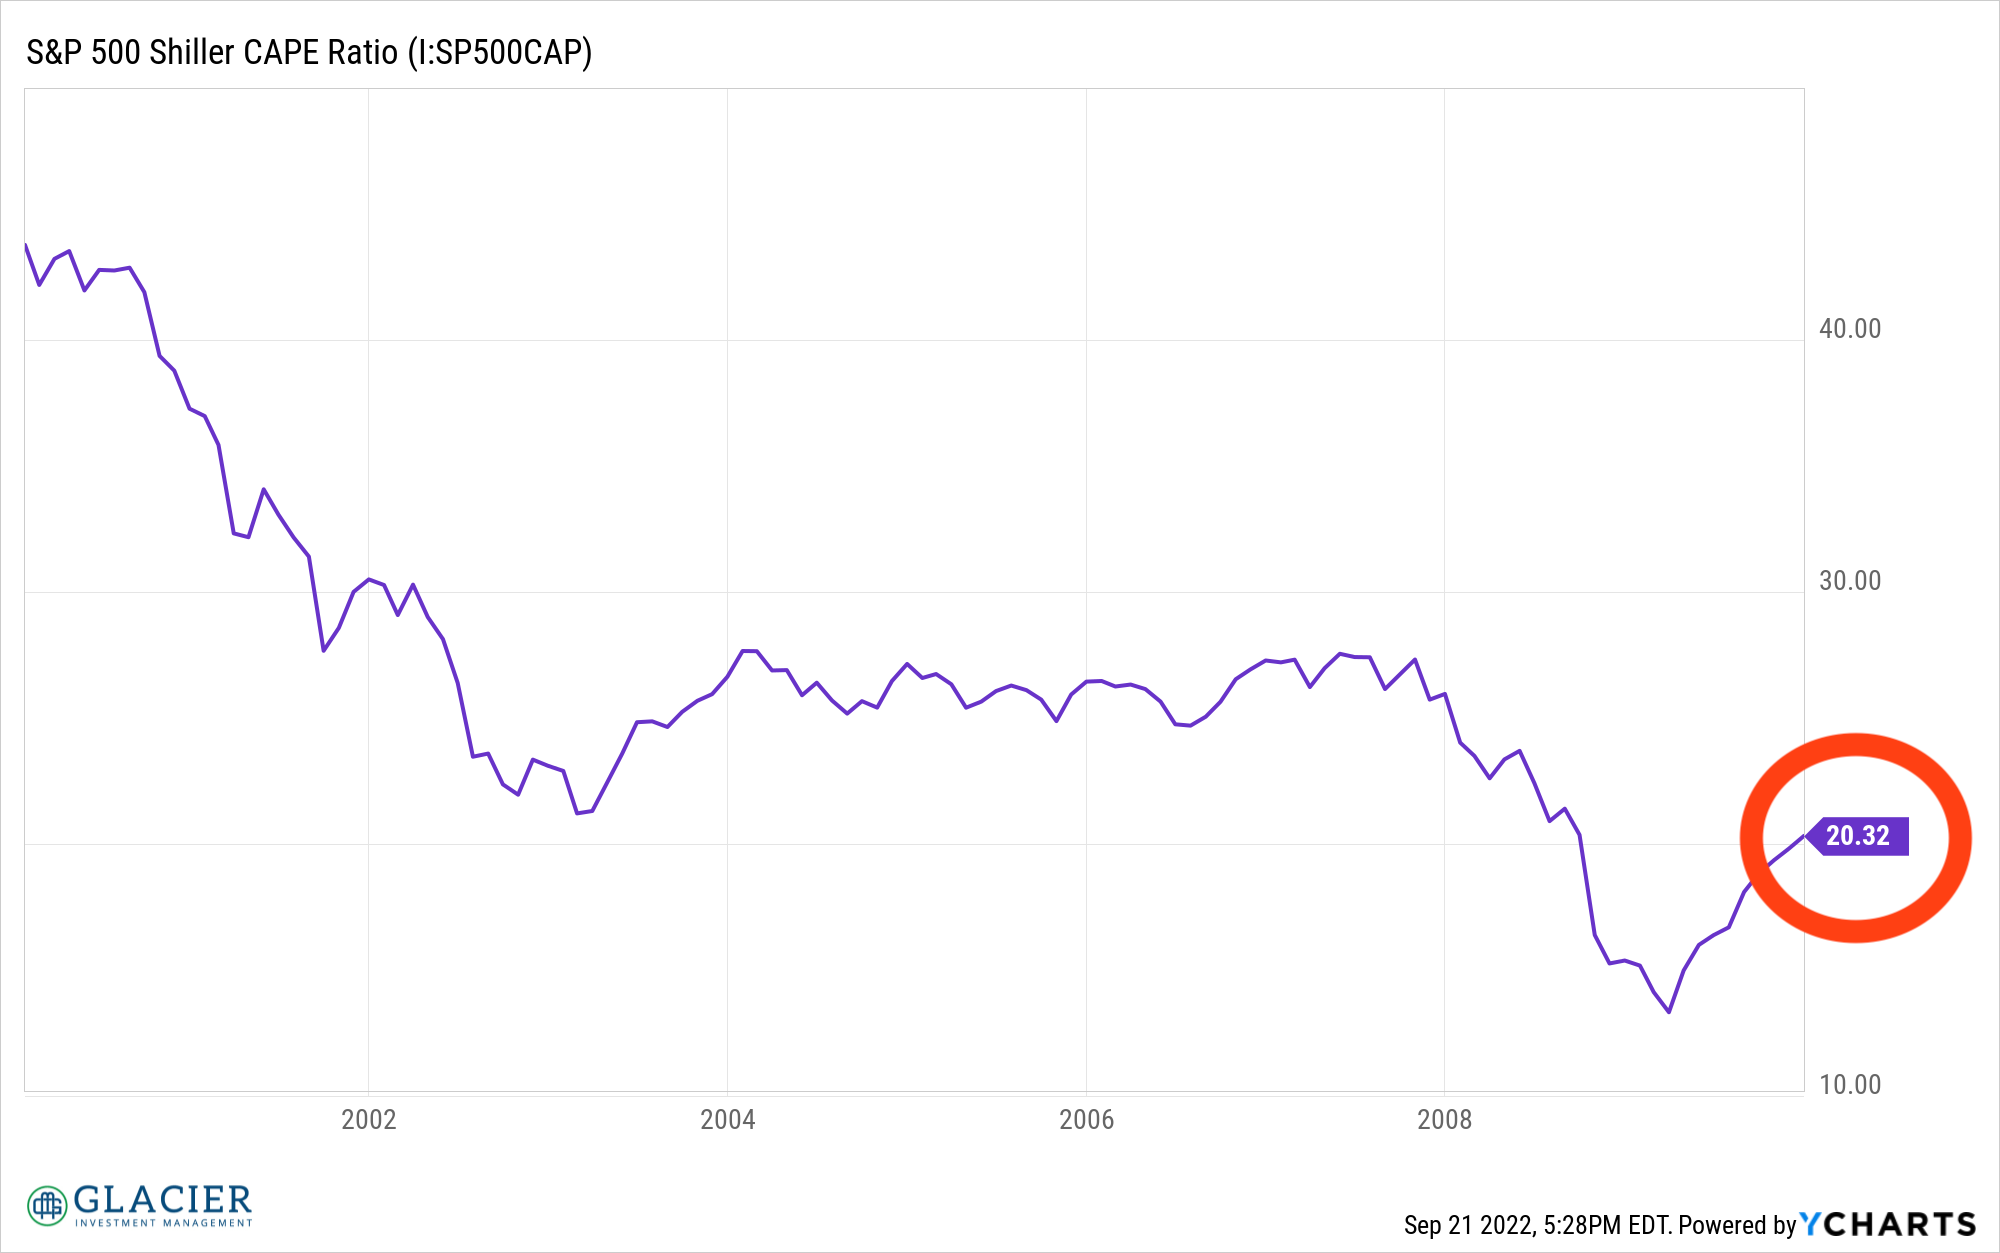
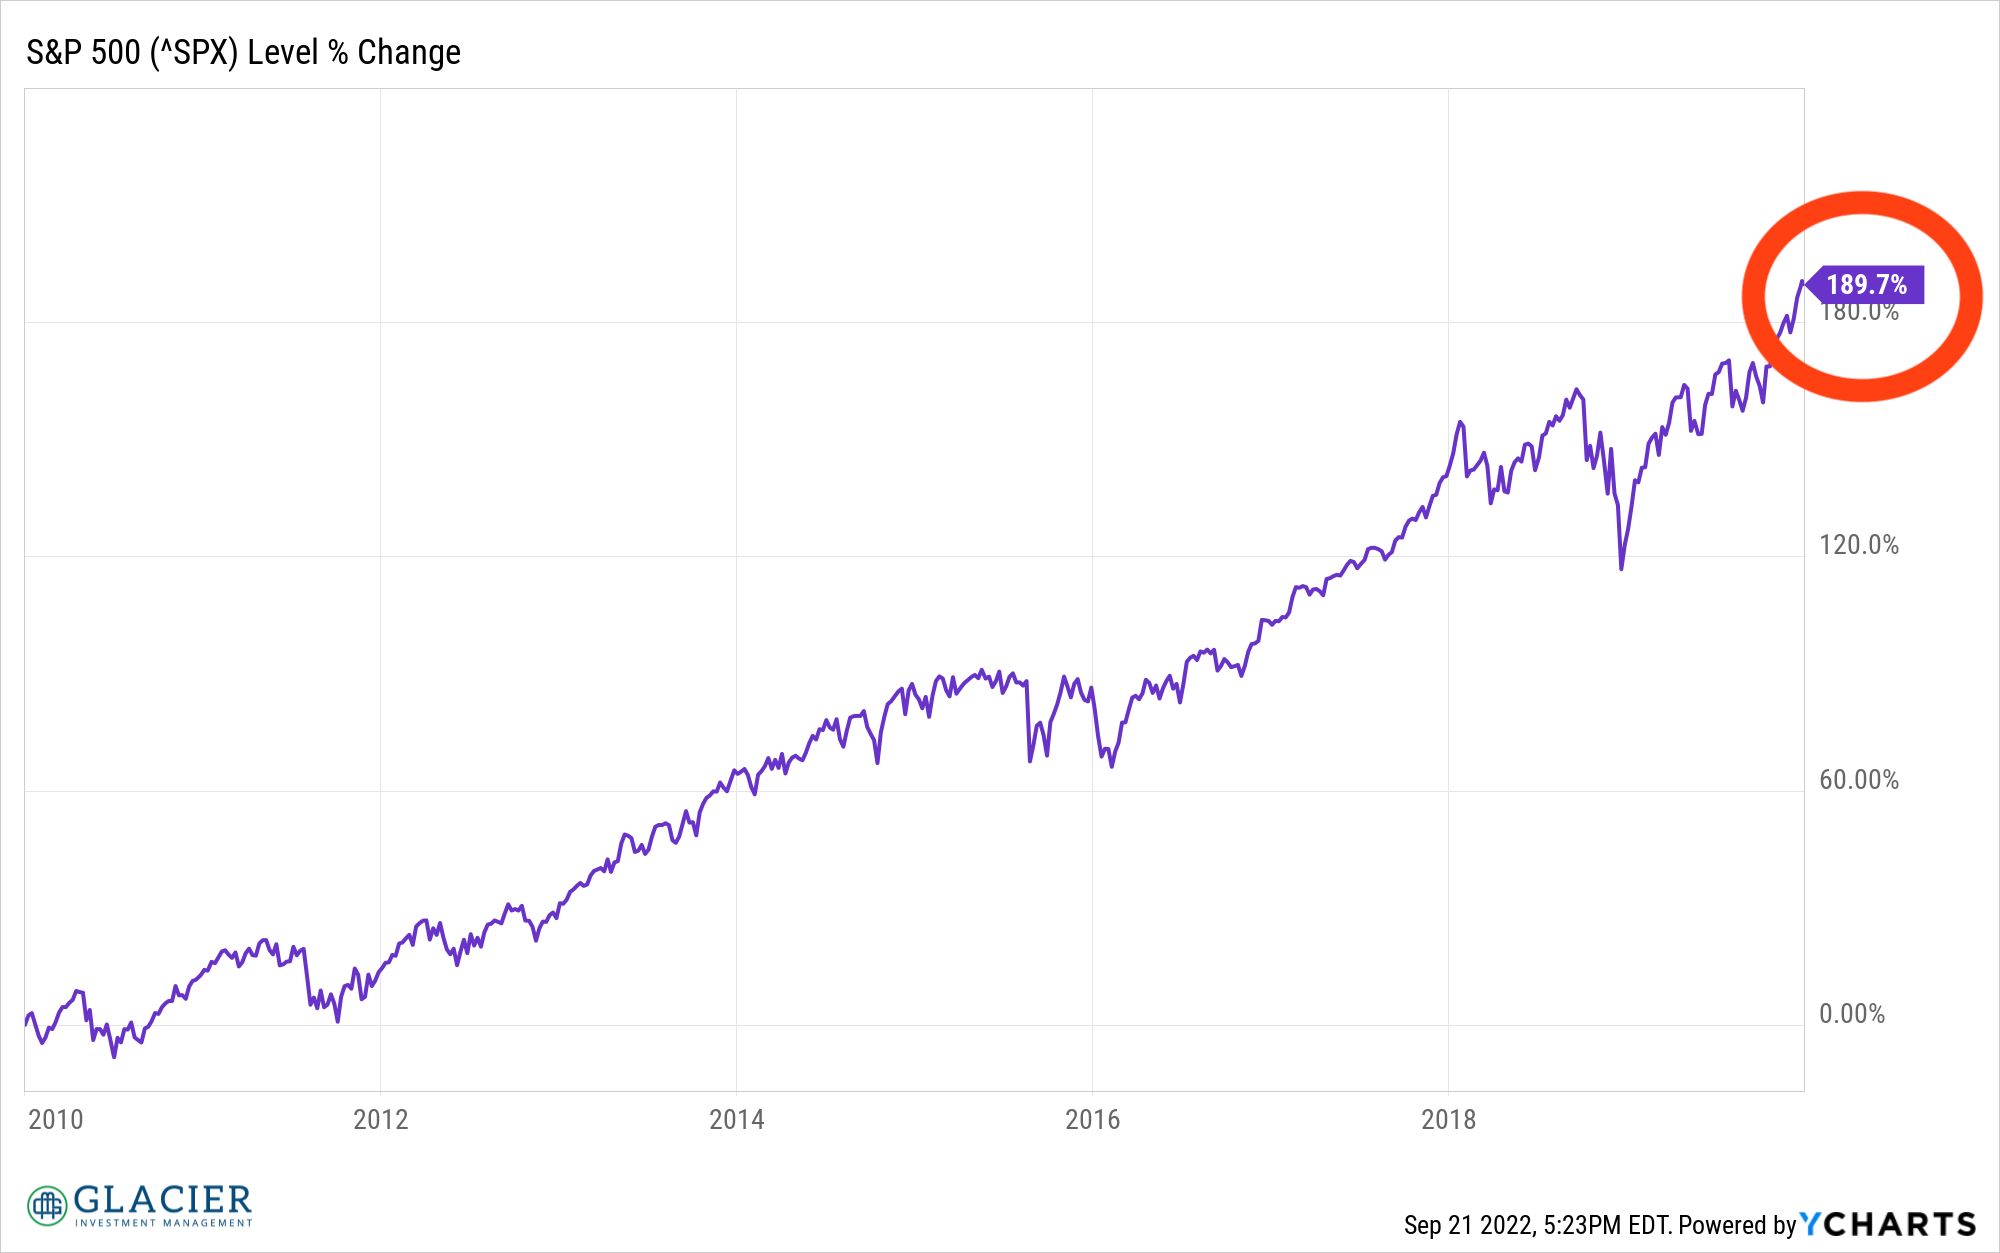
Stock market valuations at the end of the lost 2000s had fallen considerably but were still 20.3x earnings. Not cheap by historical standards but much more attractive than the 44.2x at the end of 1999. Stocks didn’t go anywhere the first two years of the decade as the shellshock from the Great Financial Crisis was still seared into investors’ and the general public’s consciousness. Additionally, industries, companies, and individuals were still digging themselves out of financial holes left in the wake of the housing and financial crises.
As balance sheets recovered, outlooks improved, and financial conditions loosened, stocks began to move higher. Earnings started to grow again and confidence in the stock market was gradually restored. The decade wasn’t without some pitfalls, but by and large it was a pretty smooth climb higher.
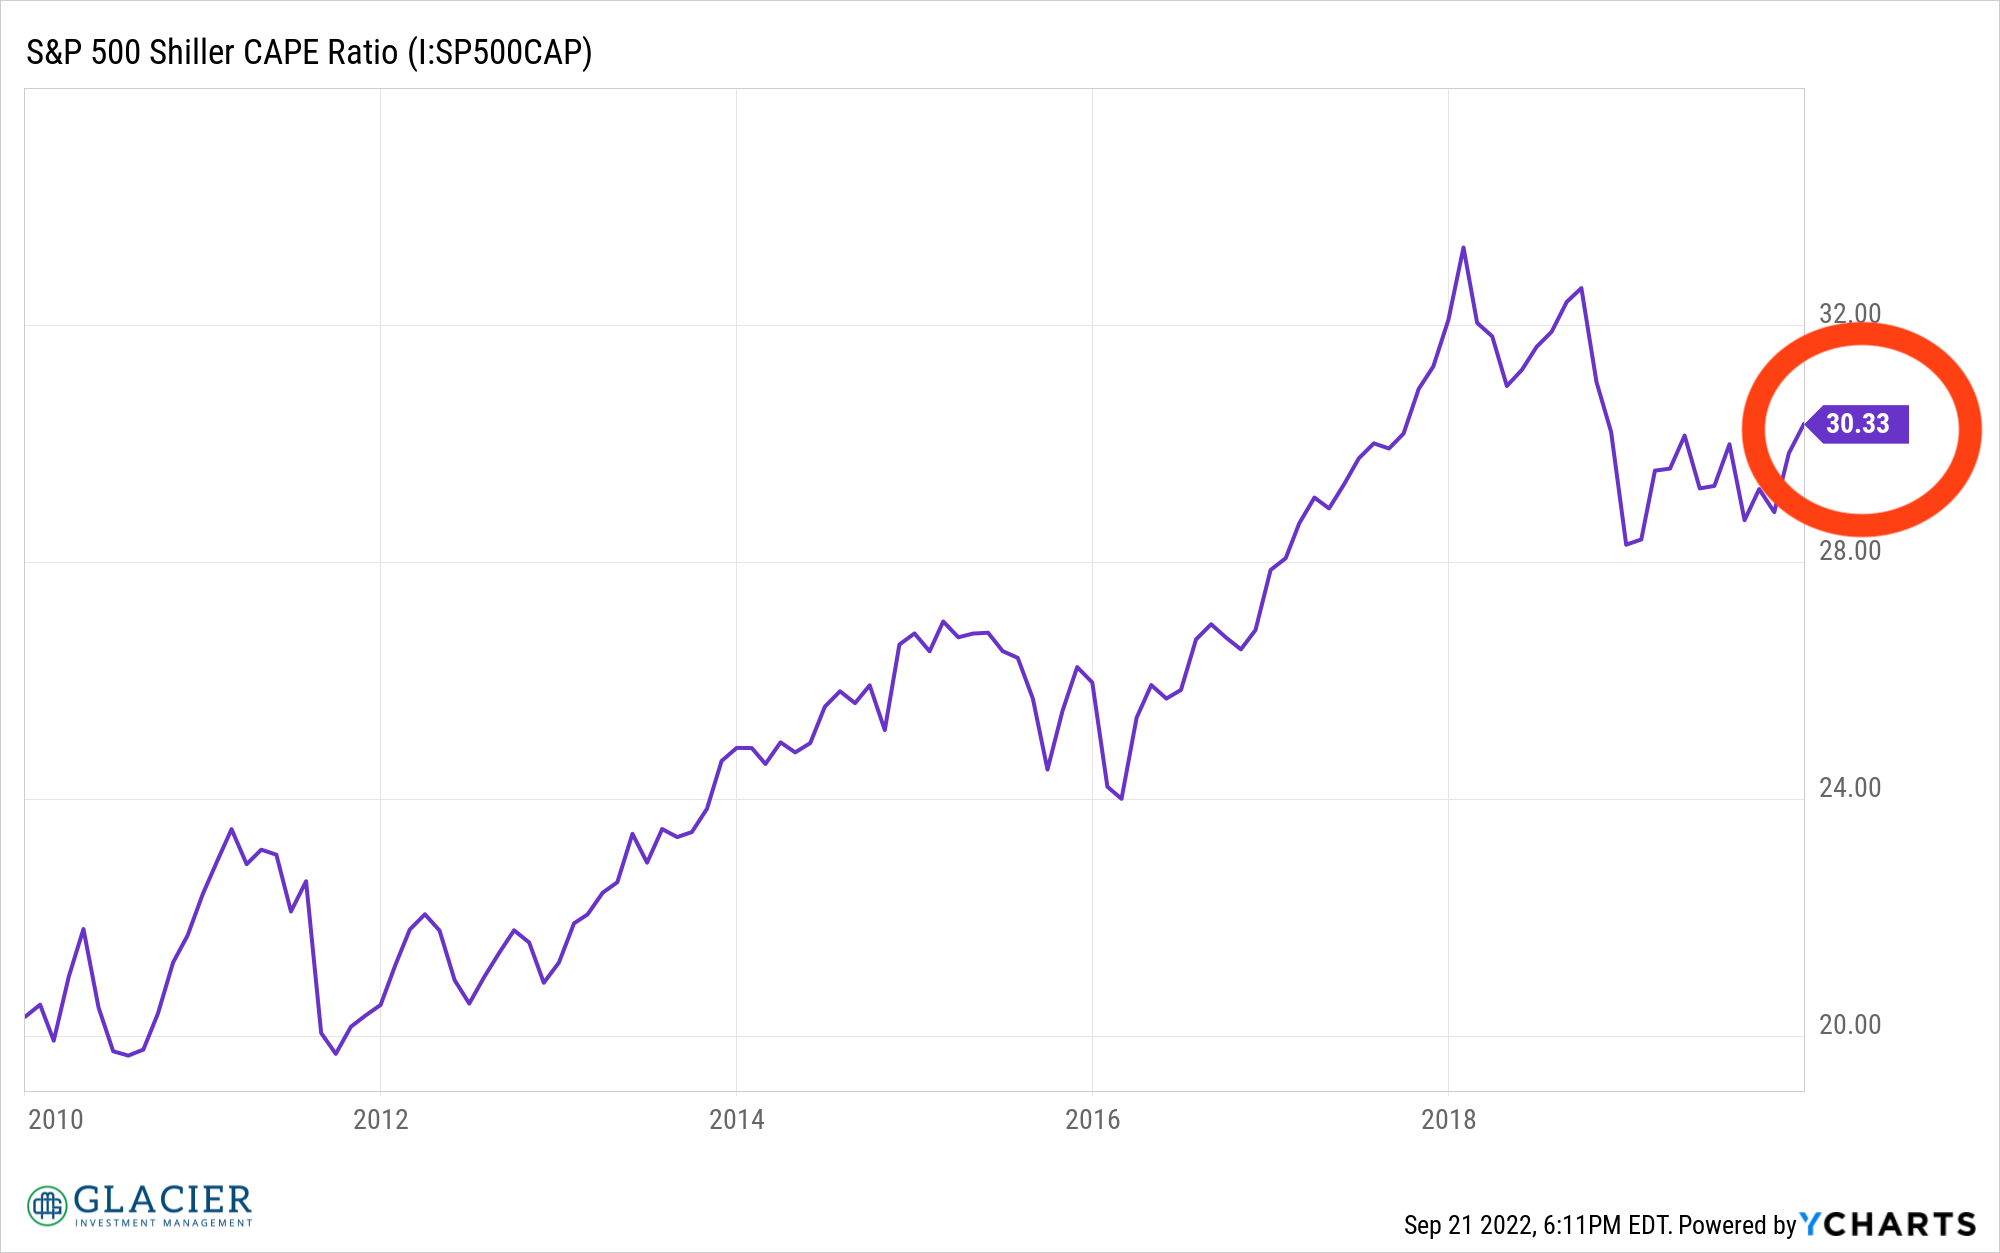
The 2020s
At the end of 2019, the Shiller CAPE was at 30.3x, an above average reading by all accounts. The beginning of the 2020s wasn’t necessarily a great point to aggressively invest in stocks based on valuation, but it wasn’t a time to be conservative either. This is what makes investing so hard. You can make a case for a cheap or expensive thesis and stocks can keep getting cheaper or more expensive for longer than you have patience or willpower.
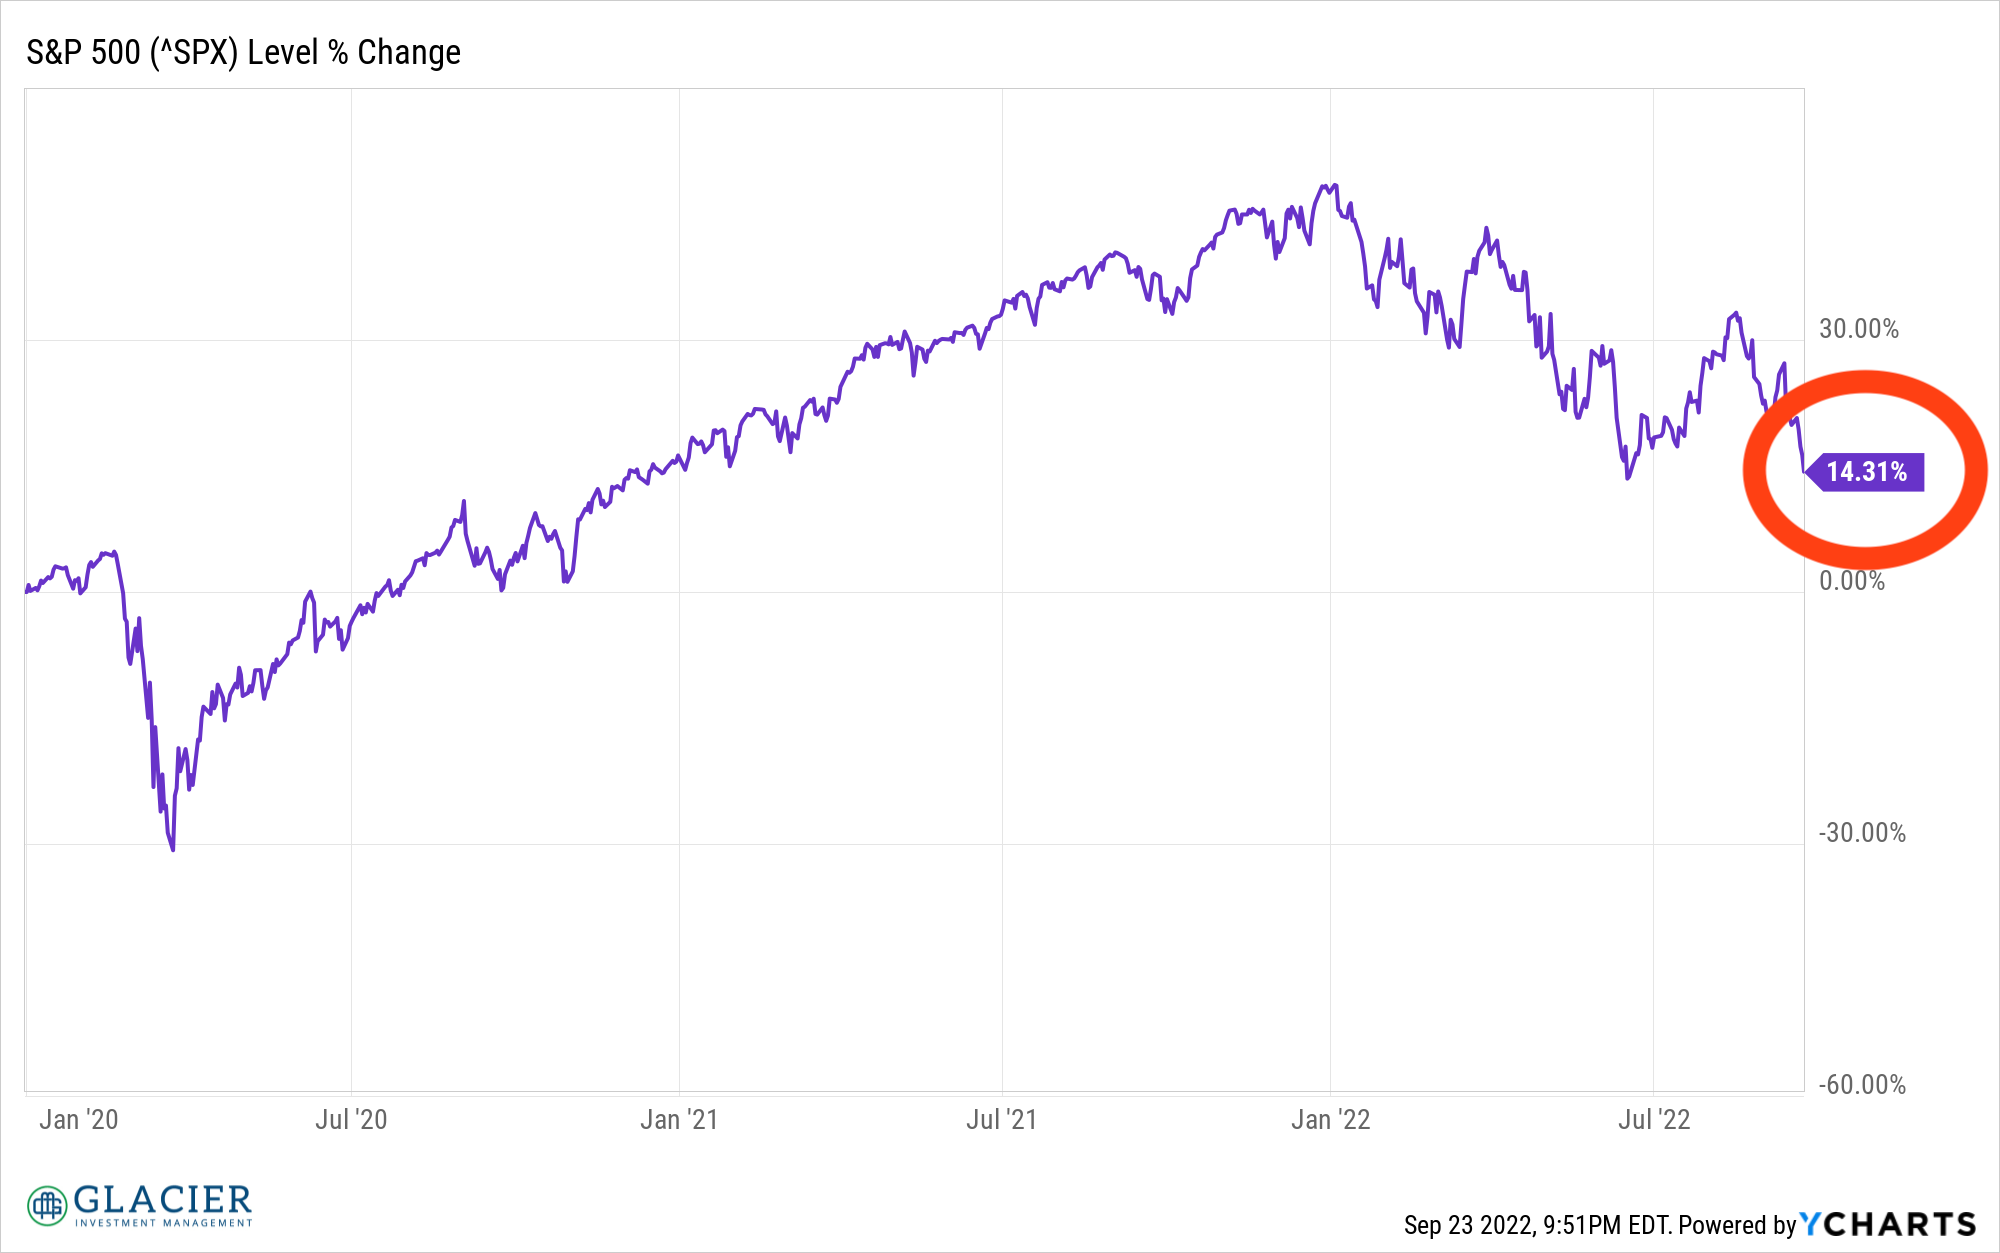
The first two years of the 2020s were incredibly strong with nearly 50% appreciation in the S&P 500. However, 2022 has largely eaten into those gains, bringing the decade-to-date return on the index to 14.3% through 9/23.
The whole point of this chart exercise is to help all of us visualize how markets move over time and how starting points can make a difference. We are in an incredibly challenging market environment right now. It is tempting to want to run for the exits, but we usually feel the urge to do that at the worst possible time, after we’ve experienced most of the pain.
Perspective is incredibly important. Having a plan and following it is incredibly important. Market environments are going to be challenging from time to time. If you don’t have perspective and conviction in your plan, you will likely wander aimlessly and may end up with a lost decade of your own regardless of what the market does.