
“…the time when past excesses are corrected is the period of greatest risk.” – George Soros
We have been living in a period of excess for quite some time now. We had the irrational exuberance for tech stocks in the late 1990s which led to excessive valuations. The credit craze of the 2000’s led to excess in the housing market. Loose monetary policy among other variables has led to what appears to be excess in the stock market today.
Let’s examine some charts to attempt to gauge the level of excess in the stock market today.
Net Worth
The first chart shows net worth as a percentage of disposable personal income. As a reminder, net worth equals your assets (cash, real estate, investments, etc…) minus your liabilities (mortgage, car loan, credit card, etc…). Currently, this metric is at record levels and appears to be quite elevated. We’re currently at about 18% above the peak reached just prior to the Great Financial Crisis 14 years ago.
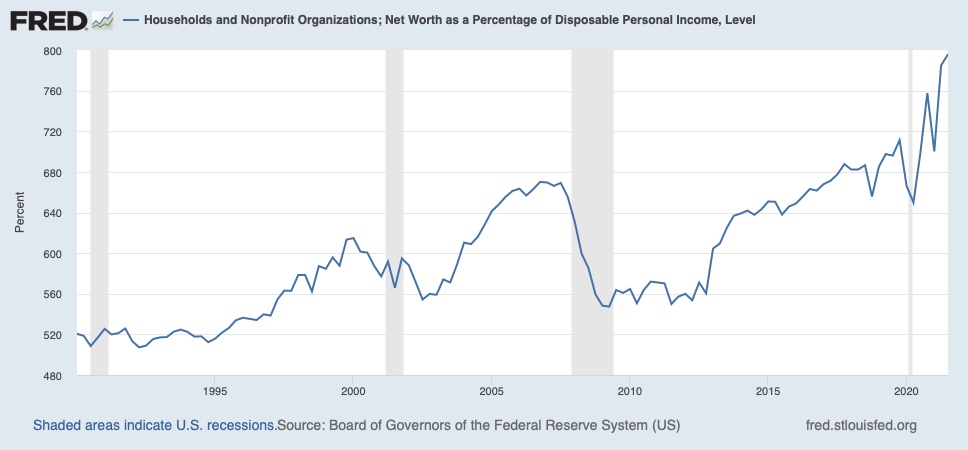
Source: https://fred.stlouisfed.org
The figure has increased rather dramatically since the pandemic which is probably excessive. However, households have been paying down debt and investing which has clearly helped to push this figure higher. Net worth is probably about 10% above the pre-pandemic trendline, which is a lot for this metric.
So, what’s driving the increase in net worth this time around? We know in the mid to late 2000s it was real estate and stocks driving the increase in household net worth. It’s likely the same this time around although stocks may be driving the majority of the run up.
Stock Ownership
In the chart below, you can see just how much stocks represent on household balance sheets. This figure has gone parabolic since the pandemic, but the chart can be a little misleading. To get from the the trough in the first quarter of 2009 to the third quarter 2021 reading the implied return on equities and mutual fund shares is 13.25% which admittedly is aggressive but not unreasonable.
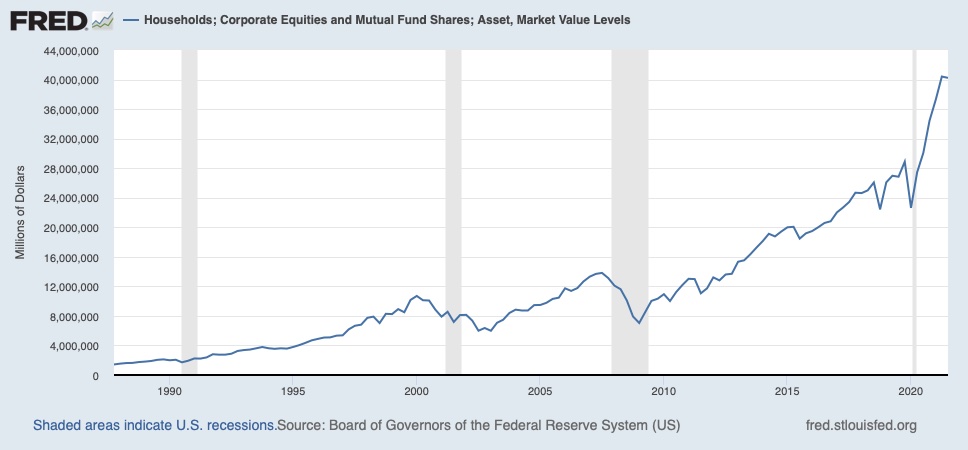
Source: https://fred.stlouisfed.org
The Takeaway
We all know how the tech and housing bubbles ended. We don’t know how the current period of excess will play out. For all we know, this could be a new normal of higher stock ownership among households and higher valuations, but I wouldn’t use that as your base case.
The safest conclusion to draw from this analysis is that future stock market returns will likely be considerably lower than the returns we’ve become accustomed to over the past several years. Those lower returns will either manifest themselves in lower annual returns for a period of years or they will come all it once in the form of a crash. Neither option is fun.
Being Prepared
My intent isn’t to scare you but to make you aware of our current reality. We can’t predict what exactly will happen and when it will occur. However, we can be aware of the current dynamics and prepared with our trusty investment plans.