
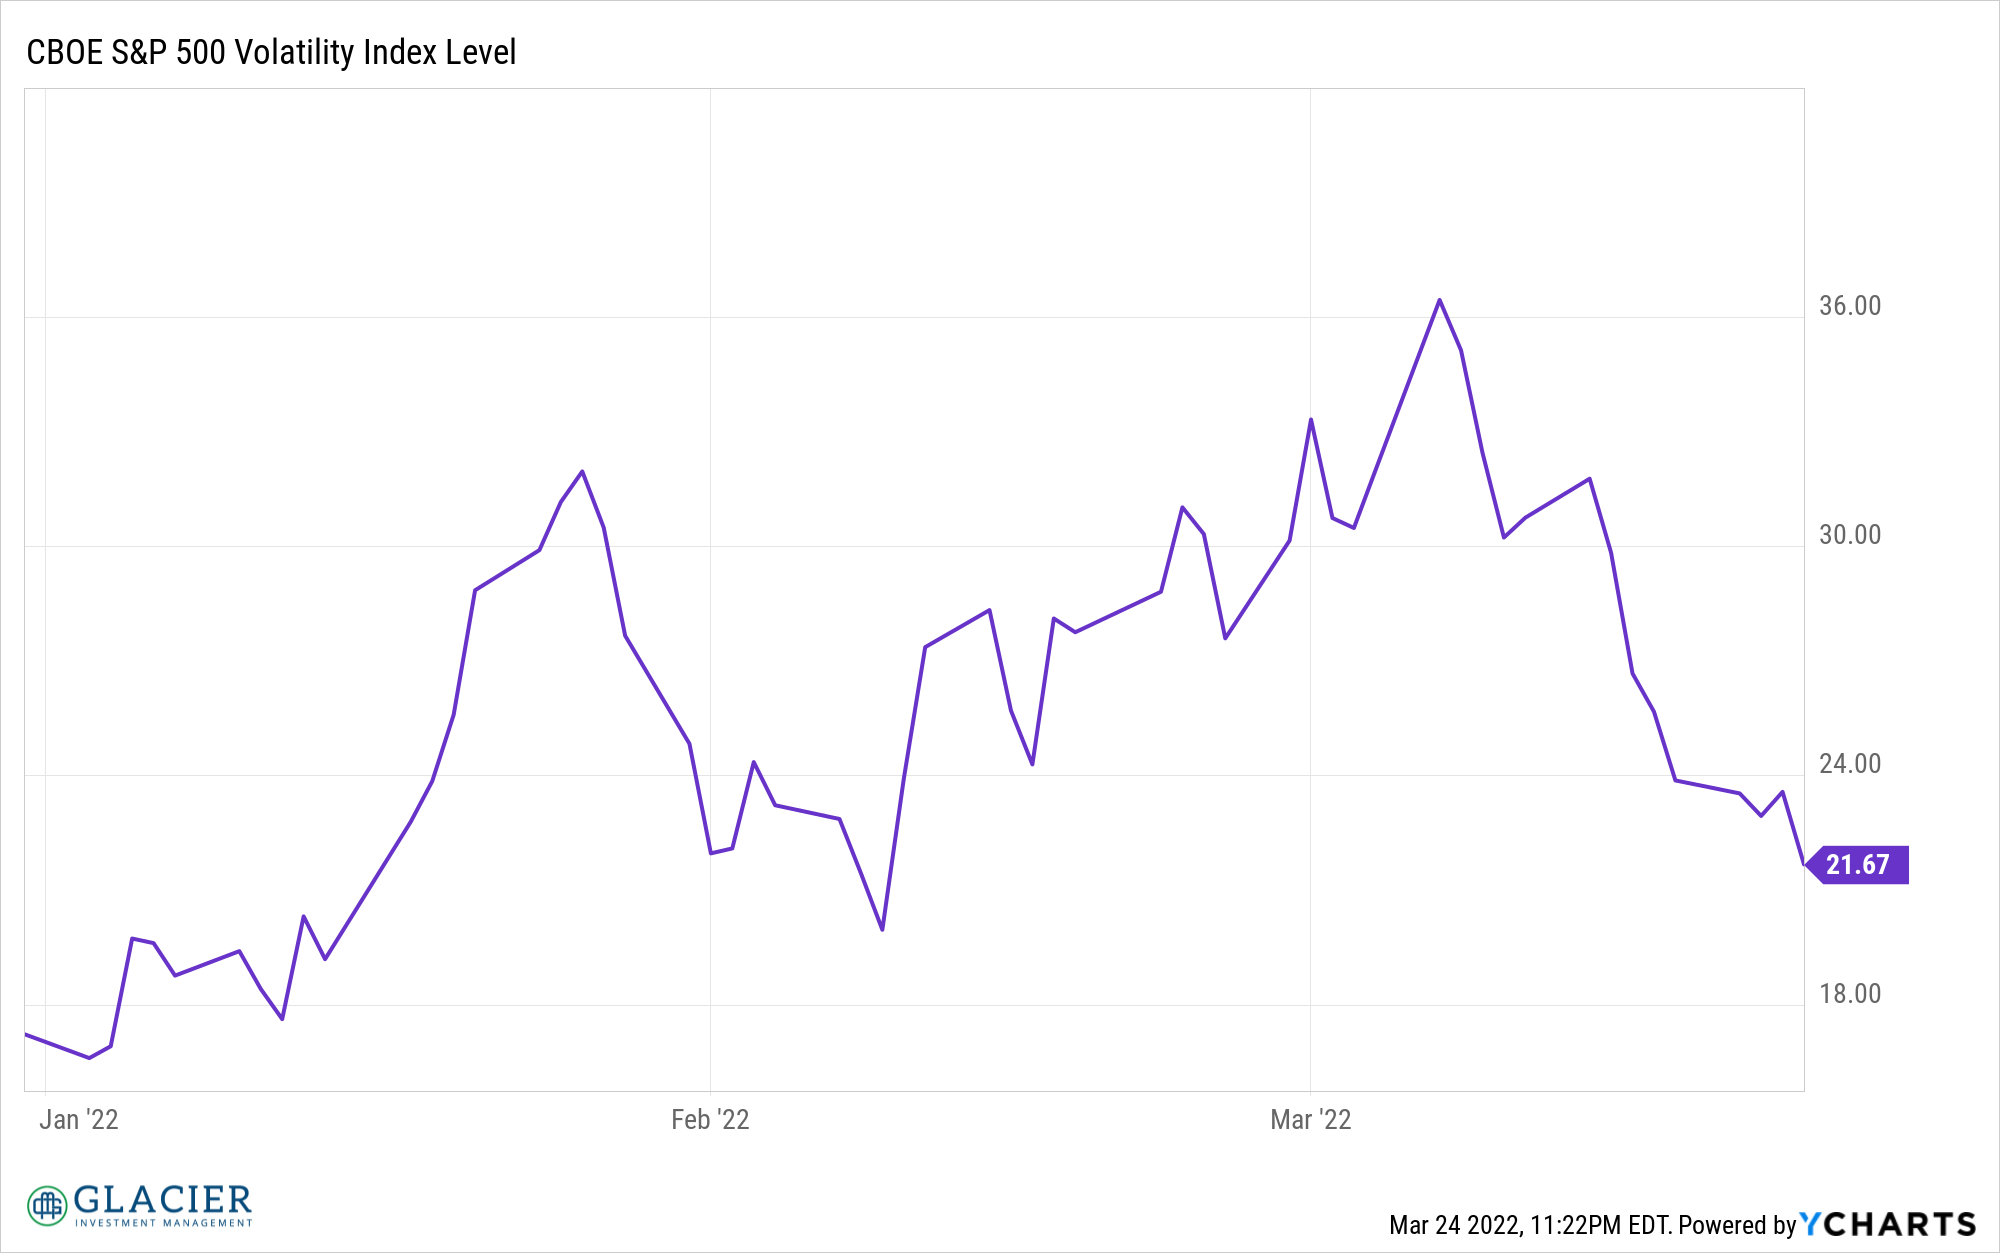
After a rough start to the year, the market appears to have settled down for the time being. Volatility is well off its peak and has been declining in recent weeks as the market bounces off of oversold levels. Pretty much everyone believes this is a dead cat bounce in the middle of a bear market. I have no evidence to suggest otherwise.
However, here are some things to consider in the context of the year-to-date market action:
No Bear Here…Yet
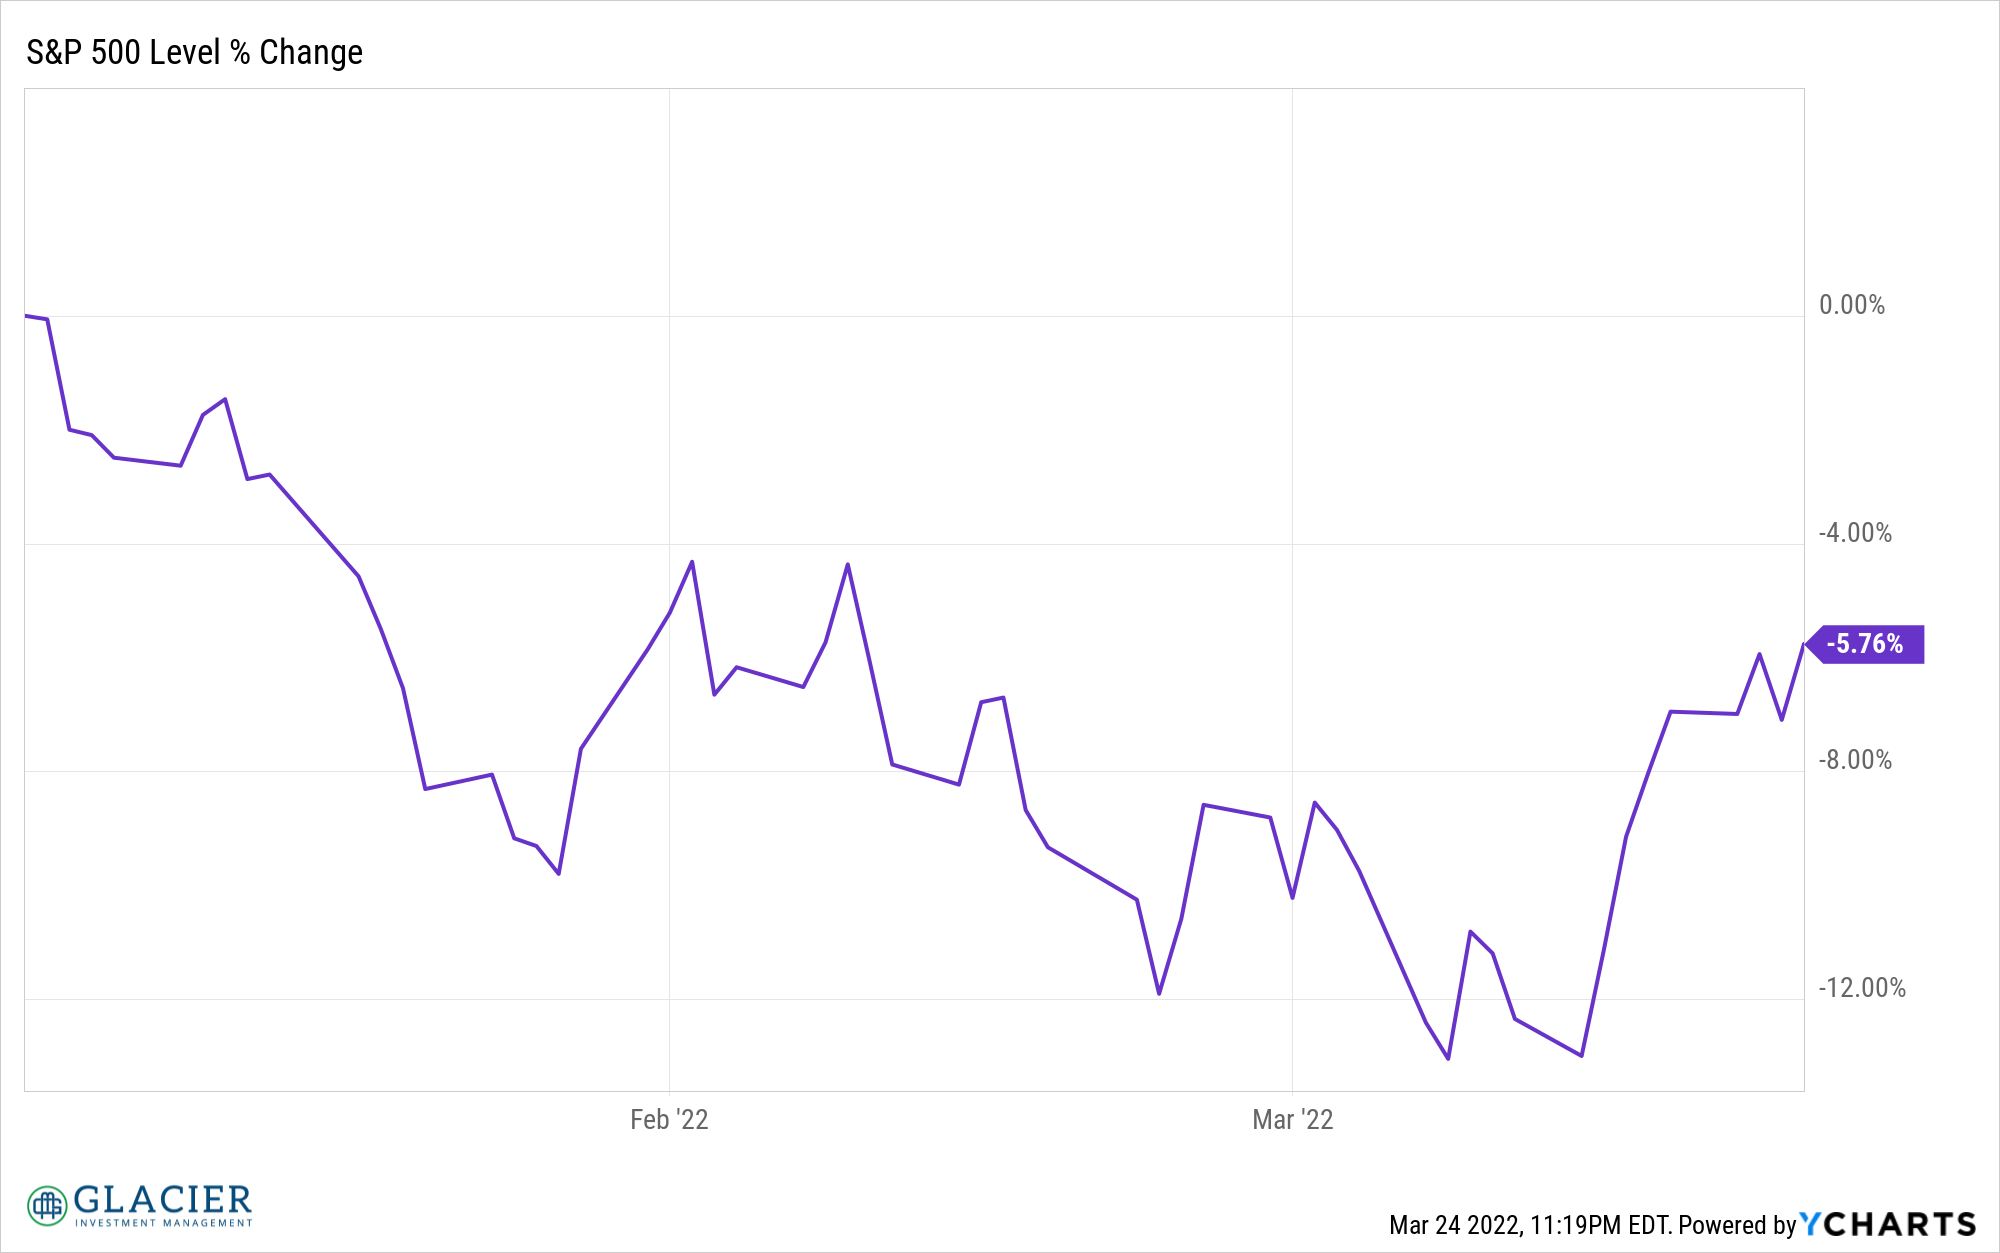
We aren’t technically in a bear market yet. We need to see a 20% decline from the peak. At the trough 10 days ago, the market was down 13% from the January 3rd peak. Since then, the market has rallied nearly 8% and is now down under 6% year-to-date.
Inflated
The cat is out of the bag. Everyone knows inflation is here. The question is whether inflation is going to be higher for longer than the market is anticipating right now or not. There are strong arguments made on both sides (higher for longer or a return to lower levels or even disinflation). I’m not leaning in one direction or the other at this point. I think you have to be prepared for either outcome (higher for longer or a return to “normal”). Drawing on the work of Ed Easterling and Ned Davis, above average inflation has weighed negatively on stocks historically, on average. One of my favorite Ned Davis charts is the year-over-year rate of inflation relative to a five-year moving average. When current inflation is more than one percent above the five-year average, the subsequent 12-month stock performance has been negative on average.
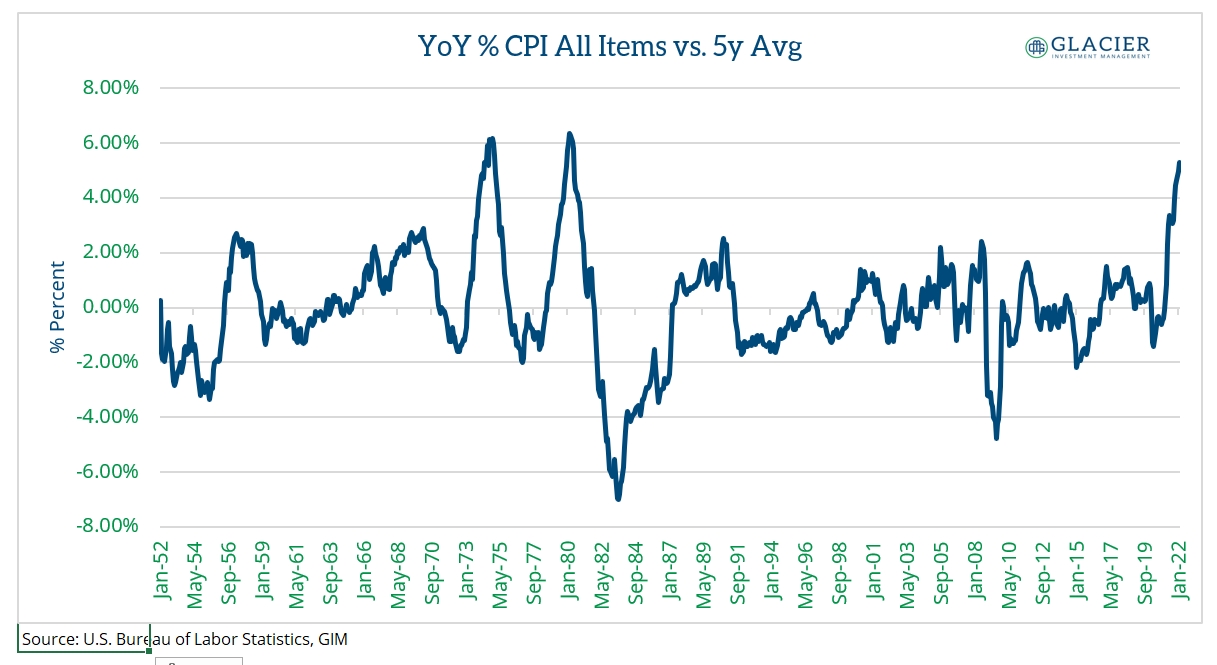 We’re well above the 1% spread threshold to the five-year average year-over-year change in the CPI. We’re actually near levels last seen in 1974 (November) and 1980 (April). The good news is that after those prints were released the subsequent 12-month performance in the S&P 500 was 31.3% and 23.5%, respectively. The economic and market environments were different back then so it’s hard to extrapolate that performance to today. FYI, the 12-month S&P 500 performance leading up to those peak print levels in 1974 and 1980 was 9% and -28%, respectively. For the 12-months leading up to our most recent reading, the S&P 500 returned about 7.4%
War
Nobody knows when or how the conflict in Ukraine will end. Some are suggesting this is just part of bigger war (WWIII) that started last year. I have no meaningful insight into this except war historically has been good for stocks. If the war suddenly comes to an end that is good for humanity and may or may not be good for stocks. An escalation would likely need to occur for the war itself to have a further negative impact on the market. Higher inflation as a result of the war is something to seriously consider and to handicap in your planning.
Hike
The Fed raised rates as expected. More rate increases are priced in. At this point, unless more or faster rate increases occur the actual increases will be a non-event. Maybe we will be surprised and there will be fewer rate hikes and no recession?
Inverted
We’re starting to hear recession calls because of a few inversions on the yield curve. Sentiment Trader had a great piece out this week highlighting the number of inversions is what matters. Of all the potential curve combinations, inversions in 50% or more would raise a major red flag. As of now, we’re at 10% which has been a non-event historically. Not all yield curve inversions lead to recessions.
For now, enjoy the positive market action. Who knows how long it will last. Maybe the market will defy the odds and keep moving higher.